 Figure 1: Dimensional qualifications varying across columns
The XBRL Open Information Model enables the XBRL report data to be represented in different formats. XBRL v2.1 defines an XML-based syntax for XBRL data (now referred to as "xBRL-XML"), and the OIM Working Group has also defined a JSON-based syntax, intended to make XBRL data simple to consume.
This document defines requirements for a CSV-based syntax ("xBRL-CSV").
As a data format, CSV has the advantages of being simple, extremely widely supported, and potentially very compact, particularly on datasets containing a large number of repeating records.
The growing trend for "granular reporting" (reporting source data in bulk, rather than summarised reports) has resulted in report sizes that push the limits of what is possible using XML and JSON-based formats.
The requirements in this document are intended to address two use cases that benefit particularly from these features.
For example, a bank may be required to report information about individual loans. This would require multiple data points (e.g. counterparty, amount oustanding, start date, maturity date) to be reported for each of a potentially very large number of loans.
Among text-based formats, CSV is the most popular choice for the distribution of large data sets. A wide range of tools are available for the selection, transformation and visualisation of tabular data in CSV format.
Recipients of XBRL data (such as regulators) may accumulate very large XBRL data sets (either by accepting large reports or a large number of smaller reports). These data sets are best exposed to interested parties in an efficient, easily digestible form.
The xBRL-CSV format should provide a very efficient representation of reports that consist of a large number of facts.
The xBRL-CSV format should not require significant structural transformation of existing tabular datasets. In other words, it should not require users to split or combine records in order to fit into the xBRL-CSV format.
It should be noted that it is not a requirement to accomodate existing CSV formats without any transformation (see Section 5.2), but the need for such transformations should be limited, and ideally constrained to transforming values to fit datatypes, rather than structural transformation of the data.
The CSV data and supporting metadata files should be easy for a human to understand.
The supporting metadata files should be easy for a human to edit. The application of xBRL-CSV to very large datasets means that human editability of the CSV data itself is not an important goal.
The xBRL-CSV format should minimise the burden on document authors and software vendors by avoiding unnecessary complexity.
The xBRL-CSV format should be capable of faithfully representing the semantic content of an OIM model.
The xBRL-CSV format should re-use structures and ideas from xBRL-JSON where appropriate.
The simplest representation of an XBRL report in CSV format is as a single document with a column for each dimension.
| entity | concept | period | unit | value | decimals |
|---|---|---|---|---|---|
| ent:01 | my:Assets | 2019-01-01T00:00:00 | iso4217:USD | 42000000 | -6 |
This representation is convenient for some forms of analysis. For example, it's easy to load it into Excel and use the auto-filter feature to browse the data.
However, a single table can get very sparse if facts use a range of different dimensional qualifications (for example, unit applies only to numeric facts, and language applies only to selected non-numerics), and there is a lot of repeated information in the table (e.g. concept names, entities) so in addition to this simple form, we will want to support alternative arrangements.
Although it is possible to present all facts in a single large table, there are a number of reasons why it may be preferable to split the report into several CSV documents:
xBRL-CSV should support reports that are made up of multiple CSV files with differing structure.
It should be possible to define information that is common to all facts in a report in a single place.
Some dimension values may be common to all facts in a report. For example, many financial reports apply to a single entity.
To avoid bloating the report with repeated values, and improve readability and editability, it is desirable to define common values in a single place.
Numeric facts in reports are often represented with a common precision (e.g. to the nearest thousand). Where this is true for all or most facts in a report, it is desirable to express the decimals value at report level.
For reports spread across multiple tables, it should be possible to define information that is common to all facts in a table in a single place.
A report may include separate tables for information about specific regions and time periods. Each of these may use a different currency. It is desirable to be able to define this information once for each table.
2019-europe-eur.csv
[unit=iso4217:EUR, region="r:Europe", period="2019-01-01T00:00:00/2020-01-01T00:00:00"]:
| metric | value |
|---|---|
| my:Revenue | 1000000 |
| my:Costs | 800000 |
| my:Profit | 200000 |
2019-america-usd.csv
[unit=iso4217:USD, region="r:America", period="2019-01-01T00:00:00/2020-01-01T00:00:00"]:
| metric | value |
|---|---|
| my:Revenue | 2000000 |
| my:Costs | 1500000 |
| my:Profit | 500000 |
Where the decimals information is not common to all facts in a report, facts may be arranged into tables such that each fact in a table has the same decimals value. Where such commonality exists, it is useful to be able to capture it at table level.
2019-usd.csv
[decimals=-6, unit=iso4217:USD, period="2019-01-01T00:00:00/2020-01-01T00:00:00"]:
| metric | value |
|---|---|
| my:Revenue | 2000000 |
| my:Costs | 1500000 |
| my:Profit | 500000 |
2019-ratios.csv
[decimals=2, period="2019-01-01T00:00:00/2020-01-01T00:00:00"]:
| metric | value |
|---|---|
| my:Margin | 0.25 |
As in the example above, changes in decimals often go hand-in-hand with changes in unit.
A number of table arrangements allow information to be shared across facts in a row.
xBRL-CSV should allow the representation of record-style data, with a key column corresponding to a dimension, and several fact columns for different concepts reported against that dimension.
| transaction_id | amount | from | to | invoice | notes |
|---|---|---|---|---|---|
| 00000000001 | 10000 | ent:001 | ent:007 | 2019.098 | 5000 FooWidgets |
| 00000000002 | 20000 | ent:001 | ent:007 | 2019.099 | 5000 BarWidgets |
| 00000000003 | 120000 | ent:001 | ent:008 | Payroll |
transaction_id corresponds to a typed dimension that uniquely identifies a transactionamount generates a monetary fact for the amount transactedfrom and to produce SQName facts identifying the sender and recipient of the amountinvoice represents invoice number (if applicable)notes captures free-form textual notes about the transactionOften a record will have a "compound key" formed from multiple fields, which correspond to multiple dimensions in an OIM report.
The key may be formed entirely from taxonomy-defined dimensions, entirely from built-in dimensions, or from a combination of the two.
For example, a report might capture snapshot information about companies over a number of years, using the built-in entity and period dimensions and concept columns for each metric recorded :
| entity | period | number_of_employees | number_of_customers |
|---|---|---|---|
| ent:FooCorp | 2018-01-01T00:00:00 | 3450 | 12350000 |
| ent:BarCorp | 2018-01-01T00:00:00 | 1230 | 34560000 |
| ent:FooCorp | 2019-01-01T00:00:00 | 3480 | 12010000 |
| ent:BarCorp | 2019-01-01T00:00:00 | 1220 | 34890000 |
Another report might store the names and descriptions of various investment vehicles, combining the built-in language dimension with a taxonomy-defined fund_id:
| fund_id | language | name | description |
|---|---|---|---|
| 001 | en | Renewable energy fund | Fund composed of companies in the renewable energy sector |
| 001 | fr | Fonds d'énergie renouvelable | Fonds composé d'entreprises du secteur des énergies renouvelables |
A third report might contain monetary figures for a number of taxonomy-defined countries, reported in both local currency and US dollars.
| country | currency | period | gdp | gni |
|---|---|---|---|---|
| r:UK | iso4217:USD | 2017-01-01T00:00:00/2018-01-01T00:00:00 | 2637870000000 | 2589020000000 |
| r:UK | iso4217:GBP | 2017-01-01T00:00:00/2018-01-01T00:00:00 | 2022257088750 | 1984742732000 |
In some table arrangements, the concept varies from row-to-row, but the majority of the columns correspond to other dimensions. For example, a regional breakdown for a number of different metrics may be expressed like this:
| metric | europe | america | asia |
|---|---|---|---|
| my:Revenue | 1000000 | 2000000 | 3000000 |
| my:Costs | 800000 | 1500000 | 2000000 |
| my:Profit | 200000 | 500000 | 1000000 |
In other cases, the columns may correspond to periods:
| metric | Q1 | Q2 | Q3 | Q4 |
|---|---|---|---|---|
| my:TotalUsers | 1000 | 2000 | 4000 | 8000 |
| my:ActiveUsers | 13 | 108 | 1435 | 6523 |
In addition to the record-style forms noted above, with the concept varying from column to column, xBRL-CSV should allow the concept to be specified by one column, with an arbitrary non-concept dimension varying across the others.
Sometimes we have dimensional information that varies from line to line, but which only applies to a subset of the columns.
For example, only the 'value' field in the following opportunity records is qualified by currency.
| opportunity_id | customer | product | value | currency | probability |
|---|---|---|---|---|---|
| a042fbb5032b0e | Foo Corporation | UltraWidget | 345000 | iso4217:USD | 0.5 |
| 3791e6ddd51b01 | Bar International | MegaWidget | 123000 | iso4217:GBP | 0.9 |
A row of data may include a mixture of instant and duration concepts on separate columns, with facts for the instant columns corresponding to either the start or end of the period used for the duration facts.
To avoid duplication of period information, it should be possible to specify the value used for the period dimension for instant facts as being either the start or end point of a duration period.
For example, a report may track loans of varying durations, taken out at
different times. In this case, the capital_repayment corresponds to a
duration concept for the capital repayed over the period, while loan_amount
and amount_outstanding correspond to an instant concept for the loan balance,
at the start and end of the period respectively.
| loan_id | fixed_rate_period | loan_amount | capital_repayment | amount_outstanding |
|---|---|---|---|---|
| C18984 | 2019-01-05/2020-06-05 | 10000 | 10000 | 0 |
| M89128 | 2017-02-11/2022-02-11 | 342000 | 27789 | 314211 |
| M89197 | 2018-11-07/2020-11-07 | 578000 | 0 | 578000 |
Tables may contain facts with a range of different types. For example, some facts may be monetary, while others are ratios. The monetary facts may be reported to the nearest thousand, while the ratios are precise to two decimal places.
If the concept is specified on each row, it is important that we also allow the decimals information to be specified along side it, e.g.
| metric | units | decimals | europe | america | asia |
|---|---|---|---|---|---|
| my:Revenue | iso4217:USD | -3 | 1000000 | 2000000 | 3000000 |
| my:Costs | iso4217:USD | -3 | 800000 | 1500000 | 2000000 |
| my:Profit | iso4217:USD | -3 | 200000 | 500000 | 1000000 |
| my:Margin | 2 | 0.20 | 0.25 | 0.33 |
Examples above have already illustrated the binding of a single dimension to a column.
Many tabular layouts use a column per metric. In OIM terms, this means binding the concept dimension on a column-by-column basis, as in this example:
| region | revenue | costs | profit |
|---|---|---|---|
| r:Europe | 1000000 | 800000 | 200000 |
| r:America | 2000000 | 1500000 | 500000 |
| r:Asia | 3000000 | 2000000 | 1000000 |
But it should be possible to specify dimensions other than "concept" on fact columns.
Here is the same information, but with the concept dimension varying row-to-row, and the region bound to each fact-producing column:
| metric | europe | america | asia |
|---|---|---|---|
| my:Revenue | 1000000 | 2000000 | 3000000 |
| my:Costs | 800000 | 1500000 | 2000000 |
| my:Profit | 200000 | 500000 | 1000000 |
We have previously noted that units are strongly associated with concepts. For tables with concepts bound to columns, where the unit is not common across all columns, it is convenient to be able to specify the unit dimension along with the concept dimension on the columns, e.g.
| region | revenue ($) | costs ($) | profit ($) | margin | number_of_users |
|---|---|---|---|---|---|
| r:Europe | 1000000 | 800000 | 200000 | 0.20 | 1194839 |
| r:America | 2000000 | 1500000 | 500000 | 0.25 | 2380108 |
| r:Asia | 3000000 | 2000000 | 1000000 | 0.33 | 9928190 |
Without this feature, we would need to partition the facts into separate tables.
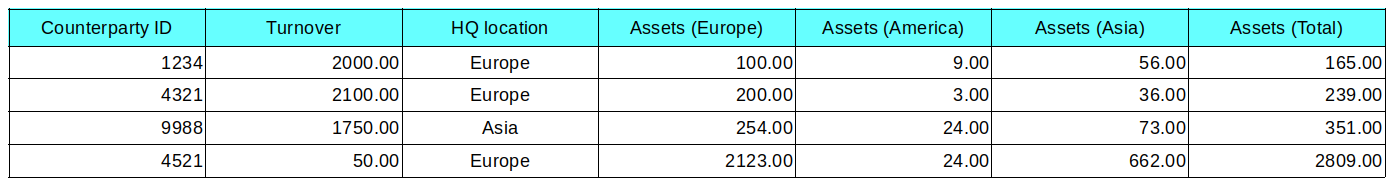
As well as varying the values for dimensions across columns, it is desirable to support tables where the set of applicable dimensions varies from column to column.
For example, the table below shows a table in which the columns are defined by a mixture of concepts (e.g. "Turnover"), and dimensionally-qualified concepts (e.g. "Assets (Europe)" ). The first column represents a typed dimension which is used to qualify all facts in a row.
Figure 1: Dimensional qualifications varying across columnsWithout the ability to do this, this would have to be broken into separate tables, as shown below.
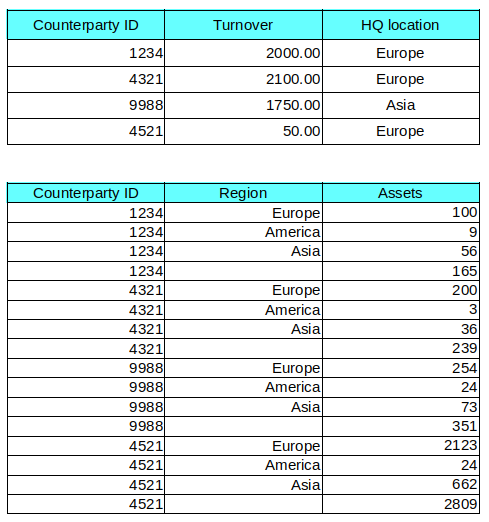 Figure 2: Alternative arrangement to avoid varying dimensions across columns
Though it is sometimes desirable to split tables out like this, it increases the size of the CSV file (see Section 3.1) and we do not want to force this kind of structural rearrangement on users of xBRL-CSV (see Section 3.2).
As well as binding the unit at column level, it is useful to be able to specify the decimals.
| region | revenue ($, -6dp) | costs ($, -5dp) | profit ($, -5dp) | margin (2dp) | number_of_users (0dp) |
|---|---|---|---|---|---|
| r:Europe | 1000000 | 800000 | 200000 | 0.20 | 1194839 |
| r:America | 2000000 | 1500000 | 500000 | 0.25 | 2380108 |
| r:Asia | 3000000 | 2000000 | 1000000 | 0.33 | 9928190 |
In keeping with the goal of fidelity, it must be possible to faithfully preserve links in an OIM report when exporting to CSV, so that the information is available to interactive tools, and so that the data can be loaded back into OIM model without data loss. No special handling is required for text footnotes, as these are represented in OIM as facts. While the information must be preserved, it is not necessary for it to be exposed in CSV form (Section 5.1).
xBRL-CSV should support the creation of predictable fact IDs, so that facts can be traced back to source data, and to permit the association of external information (such as error messages or comments) with facts.
Fact IDs should not be position-based. In other words, re-ordering rows or columns should not affect the generated IDs.
It is not necessary to support the specification of individual fact IDs (see Section 5.7).
The syntax used for Extensible Enumerations in xBRL-XML differs between EE 1.0 and EE 2.0, but they are represented consistently in xBRL-JSON (using QNames).
xBRL-CSV should represent EE values in the same way as xBRL-JSON.
The process of mapping CSV documents to an OIM Report relies on a range of metadata:
It is theoretically possible to represent all of this information in CSV format, but much of it is more naturally and conveniently represented in JSON. Accordingly, there is no requirement for the supporting metadata to be stored in CSV form.
xBRL-CSV is not required to support the mapping of "arbitrary" CSV file arrangements into XBRL. Although many tools have CSV export functionality already, the implementation of a new reporting requirement using xBRL-CSV or any other format will necessarily involve some degree of integration work, and it is not unreasonable to require some level of transformation of data as part of this.
For example, it is not necessary to support multiple date formats. Implementers can be expected to transform dates into a standard format for use in xBRL-CSV.
Inline XBRL provides features for adjusting the scale and sign of values as part of the mapping process that produces an XBRL report.
Many existing CSV documents would also benefit from these transformations. For example, financial data is often reported in thousands or millions.
However, the use cases for xBRL-CSV do not include the mapping of existing CSV documents (Section 5.2); the focus is on allowing efficient representation of OIM models in CSV form. Accordingly, scale and sign transforms are out of scope for xBRL-CSV 1.0.
Inline XBRL uses a registry of transformation functions to translate strings in a range of formats to XML Schema data types. For example, to convert 26-Apr-2019 to 2019-04-26.
Similar functionality would be useful for coping with arbitrary CSV files, but this is out of scope for xBRL-CSV 1.0 (see Section 5.2).
Representation of data in OIM may involve the mapping of external code lists to concepts and domain members in a taxonomy. One way to achieve this would be to place the mapping information in a JSON structure within the metadata file.
For xBRL-CSV 1.0, the assumption is that such transformations will be achieved by pre-processing steps.
Existing table structures may have several columns that map to a single dimension or fact value in the the XBRL data model.
For example, period information may need to be assembled from separate year, month and day columns.
While it may be useful to provide a feature in xBRL-CSV to handle this, it is out of scope for xBRL-CSV 1.0.
Existing table structures may have a single columns that maps to multiple dimension or fact values in the the XBRL data model.
For example, bank details may be stored as single account + sort code field, which needs to be split into separate account and sort code facts.
While it may be useful to provide a feature in xBRL-CSV to handle this, it is out of scope for xBRL-CSV 1.0.
In some cases the mapping from existing table structures to XBRL will involve the combination of source data with some fixed information. For example,
By storing the fixed information in the xBRL-CSV metadata, and combining it with source data dynamically as we produce facts, we can improve compactness, readability and editability.
While it may be useful to provide features in xBRL-CSV to handle these use cases, all are out of scope for xBRL-CSV 1.0.
In spreadsheets and Business Intelligence tools data can be pivoted for presentation, often with multiple headers on the x and y axes. This is also supported by XBRL's Table Linkbase specification.
We do not intend to support such arrangements for xBRL-CSV 1.0.
Whereas xBRL-CSV allows dimensions to be bound to a column, there is no corresponding requirement to support metadata bindings for rows. Instead, each dimension that you want associated with facts in a row must be present as a column in the CSV file.
For example,
| tag | value |
|---|---|
| Revenue (Europe) | 1000000 |
| Revenue (America) | 2000000 |
| Revenue (Asia) | 3000000 |
| Profit (Europe) | 200000 |
| Profit (America) | 500000 |
| Profit (Asia) | 1000000 |
Must be represented as
| metric | region | value |
|---|---|---|
| my:Revenue | r:Europe | 1000000 |
| my:Revenue | r:America | 2000000 |
| my:Revenue | r:Asia | 3000000 |
| my:Profit | r:Europe | 200000 |
| my:Profit | r:America | 500000 |
| my:Profit | r:Asia | 1000000 |
It is not difficult to imagine extending a specification for mapping CSV tables to cover the same structures embedded in HTML documents and spreadsheets.
Such work is out of scope for xBRL-CSV 1.0.
It is not required to be able to consume xBRL-CSV without access to DTS information. xBRL-CSV may rely on the availability of datatype, dimensional or other taxonomy information in order to correctly consume xBRL-CSV data.
It is not necessary to support the specification of IDs for individual facts. This has the consequence that it will not be possible to include fact IDs from OIM data from other sources, although the requirement for predictable fact IDs in xBRL-CSV (Section 4.8) means that traceability could be maintained via external mapping tables.
Reports may contain values that are expected to correspond to identifiers for rows in another table. For example, a table containing loan data may contain more than one loan for a single counterparty, and it may make sense to normalise counterparty information (e.g. name and address) into a separate table that is referenced from records in the loan table.
It is desirable that such relationships can be validated efficiently on the large datasets that xBRL-CSV is intended for use on, but specific functionality to address this is out-of-scope for the intial release of xBRL-CSV.
Some markup formats for tabular data refer to columns by numerical index.
Such references are brittle, and hard for humans to follow. In the interests of clarity and safety, we require that all xBRL-CSV documents have column headers.
It is acceptable for xBRL-CSV to constrain the format of column headings in the CSV, in order to meet the syntactic constraints of identifiers.
Significant work on semantic markup for CSV documents has already been undertaken by the W3C's CSV on the Web (CSVW) working group, culminating in the 2015 publication of the Model for Tabular Data and Metadata on the Web.
While this work provides a useful reference point, there are a number of differences between their requirements and ours:
Review of the initial CSVW-based draft of xBRL-CSV (2017-05-02) found that the requirement to conform to the CSVW model was introducing complexity and limiting our design freedom, without offering sufficient compensating benefits.
Accordingly, we will not require xBRL-CSV to be built on this existing work. Instead, we will focus on sharing as much as possible with the xBRL-JSON specification (Section 3.7).