1 Introduction
Presentation linkbases, according to the XBRL 2.1 specification [XBRL 2.1], establish relationships between items in a taxonomy for presentation purposes. For many years, this resource has allowed taxonomy authors to arrange sets of concepts into hierarchical representations, helpful to convey better the meaning of those financial concepts as part of a group, rather than as isolated, individual elements. These relationships have served other purposes, such as the creation of user interfaces, or the rendering of instance documents. Simple balance sheets and profit & loss statements are a good example.
The release of XBRL Dimensions [DIMENSIONS] introduced a new degree of flexibility in the design of taxonomies. It enabled the modelling of complex data and richer relationships. However, under this specification, a financial concept could be expressed as the combination of several elements (primary item plus a variable number of (dimension, member) pairs) rather than as a single item. This new facility exposed an important limitation in the capabilities of XBRL to express presentations or views of multidimensional models. This has been partially solved in different projects using different approaches.
The purpose of the table linkbase is to supplement the presentation linkbase by providing taxonomy authors with a standard way to define views of the concepts defined in XBRL taxonomies which overcomes most of the limitations of the presentation linkbase. Rather than providing a simple arrangement of concepts as a hierarchy, it enables the definition of tables with multiple axes. The components of these axes are not limited to individual items; instead, they can be defined in terms of a combination of dimensions, time period references, units, entities or any other property that can be used to identify the financial facts represented by taxonomies.
As a consequence, a table linkbase provides a better understanding of the concepts modelled in taxonomy files by combining them with other concepts as part of tables. A table represents a subset of the complete model provided by a taxonomy, and thus it could be used to represent reporting requirements (for instance, the subset of data required by a supervisor); to represent a view of the data for analytical purposes; or to present an instance document in a certain way.
Though formatting artefacts are not part of the table linkbase, tables are intended to be the foundation of the rendering specification. Tables identify the data to be rendered, its order and some basic graphical arrangement. The table linkbase specification will be complemented by the rendering specification to allow the possibility of specifying accurately the way an instance document ought to be rendered and the way its content should be formatted.
By design, the use of table linkbases is not restricted to the display of existing facts from an instance (data presentation). A table linkbase can also be used to describe the shape of a form into which facts may be entered to create a new instance (form entry). There is a considerable overlap between these two uses. The same table may be used (subject to some restrictions) both for form entry and for presentation of existing data. In some cases, data presentation and form entry may be combined to allow a user to edit existing facts as well as enter new ones.
This overview provides a high-level introduction to the syntax and semantics of the table linkbase. The accompanying specification provides the feature descriptions in a rigorous manner for implementation and validation.
2 Processing model
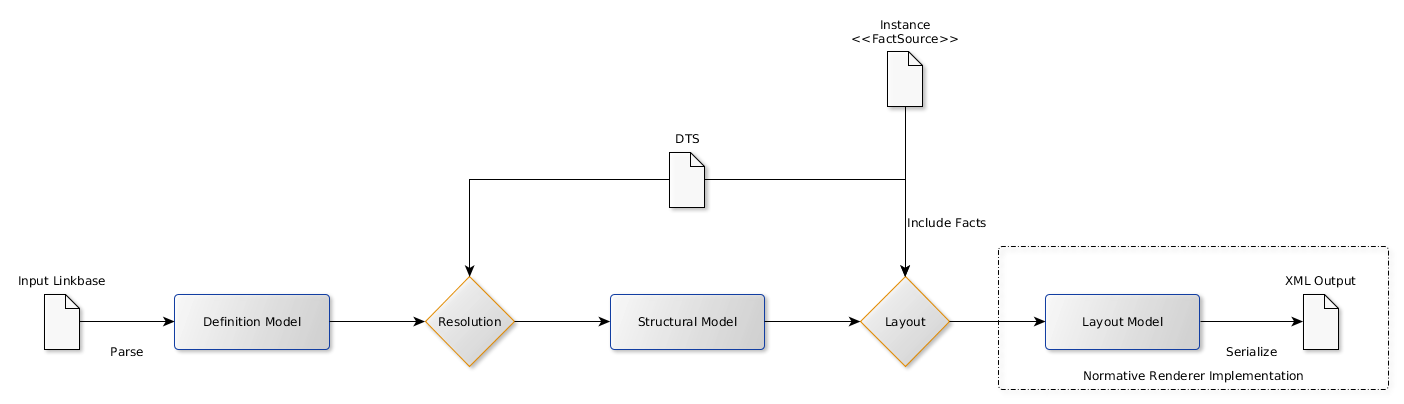
The table linkbase specification defines a sequence of three models and processes for transforming each model into the next. The three models are: the structural model, the definition model and the layout model.
2.1 Table models
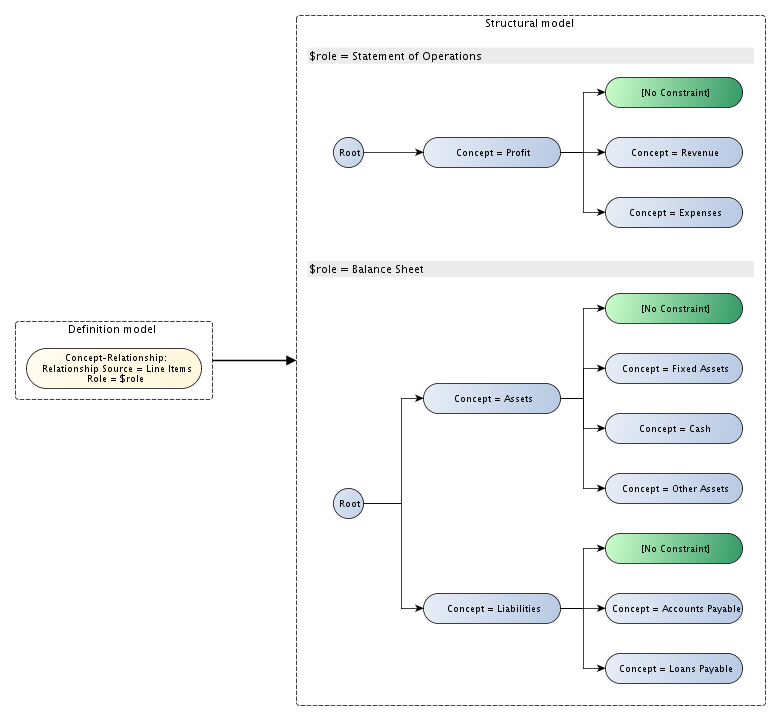
The definition model is a model of the content of the table linkbase which defines the table(s). It is syntax-independent, retaining the same semantics as the table linkbase, but without syntactical details such as XML or XLink. It is also independent of the instance and its DTS.
The structural model represents the structure of the table, independent of the way it was defined and any details pertaining only to the way it will be rendered. It is not just independent of syntax, but independent of definition; there may be many definition models which resolve to the same structural model given appropriate input. The structural model captures the meaning of the financial table.
The layout model is a direct representation of the structure and values expressed in the final rendered output. It is essentially the structural model, with all breakdowns projected onto the x, y or z-axis, populated with values from a fact source (usually an instance), and transformed into the shape required by the output format. The layout model corresponds directly to the XML format used for the conformance suite control files.
2.2 Processes
Resolution is the process of transforming a definition model into a structural model. The instance's DTS may be required to resolve a definition model to a structural model (for example if the definition model specifies a tree of concepts from a starting point in a network). Resolution does not fully resolve definitions which depend on the instance itself (such as definitions meaning "all concepts appearing in the instance"), as these semantics must be preserved in the structural model.
Layout is the process of transforming a structural model into a layout model. It involves projecting all breakdowns onto the x, y or z-axis, creating table headers using labels defined in the linkbase and populating the table with values from a fact source (usually an instance).
2.3 Other participants
Other objects which participate in processing the table linkbase include:
- Input linkbase: the input syntax which describes the definition model.
- Discoverable Taxonomy Set (DTS): the taxonomies and other linkbases necessary to resolve the definition model to a structural model. Typically this will be the DTS of the instance to be rendered.
- Instance: acts as a fact source for the renderer to look up facts satisfying a set of constraints when populating the layout model from the structural model.
3 Structural model
NOTICE:
In the structural model, rows and columns are equivalent except for their affinity with a particular axis in the final rendering. To avoid unnecessary verbosity, the more appropriate term will be used alone in parts of this section. Statements about rows and columns in the structural model are interchangeable, except where they refer to specific examples; in which case an equivalent statement could be made if the x and y axes in the example were swapped.
The structural model consists of table sets, which in turn consist of tables.
3.1 Tables
The structural model consists of trees defining the axes of the table. The nodes in these trees specify constraints (often in terms of aspect values), which the facts to be rendered in cells must satisfy. When the table is used for form entry, facts entered by the user must satisfy the constraints for that cell.
These nodes may be open or closed. A closed node specifies constraints for a single column. An open node "expands" (during layout) to specify multiple columns. Open nodes are used to indicate a range which depends on the instance data, such as "all periods in the instance".
Each axis in the structural model consists of a series of trees. Each tree defines a logically separate breakdown of the fact space by constraints. Each breakdown contributes a set of constraints for each column. These breakdowns are projected onto the axis by taking the cross-product of these sets of constraints (as described in Section 5.1.2).
3.1.1 Axes with a single breakdown tree
Each path through the breakdown tree from root to leaf defines a set of constraints to be satisfied by all cells in a given column of the table. Each closed leaf node corresponds to exactly one column. Each open leaf node corresponds to an unbounded series of columns. A node in the tree which has descendants will typically correspond to a header cell in the final rendering which spans the header cells corresponding to those descendants.
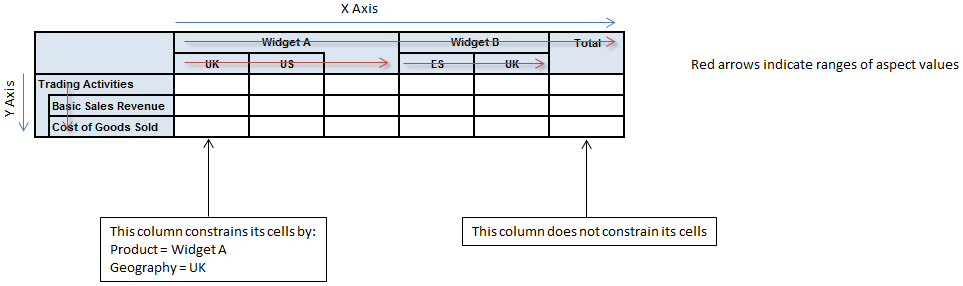
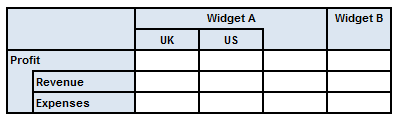
For constraints defined in terms of aspect values, if conflicting constraints (different aspect values for the same aspect) are present in this path, the aspect value closest to the leaf is used. In Figure 2, the path for the second row includes the values "Trading Activities" and "Basic Sales Revenue" for the concept aspect. Only the latter participates in the set of aspect value constraints which are satisfied by every cell in that row. Contrast this with the first column, which has both aspect values "Widget A" (for the "Product" dimension aspect) and "UK" (for the "Geography" dimension aspect) in the set of aspect value constraints.
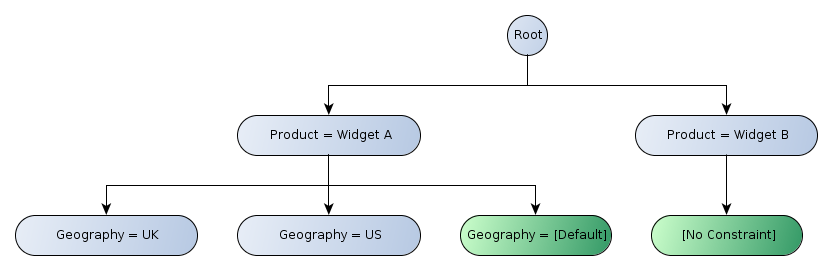
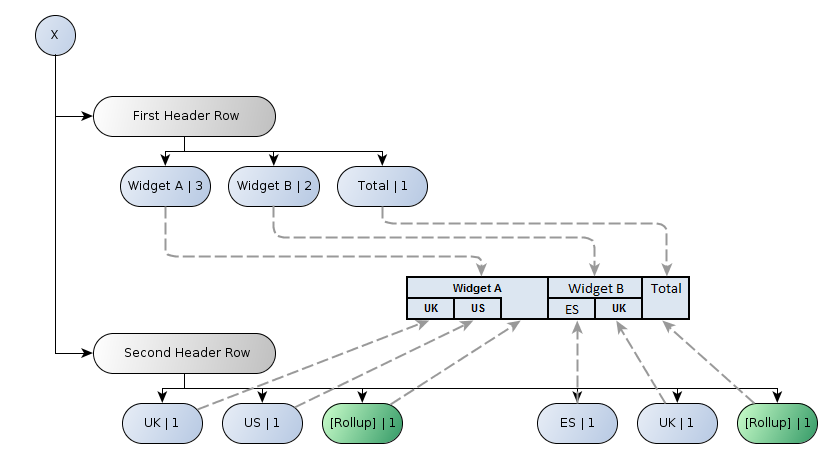
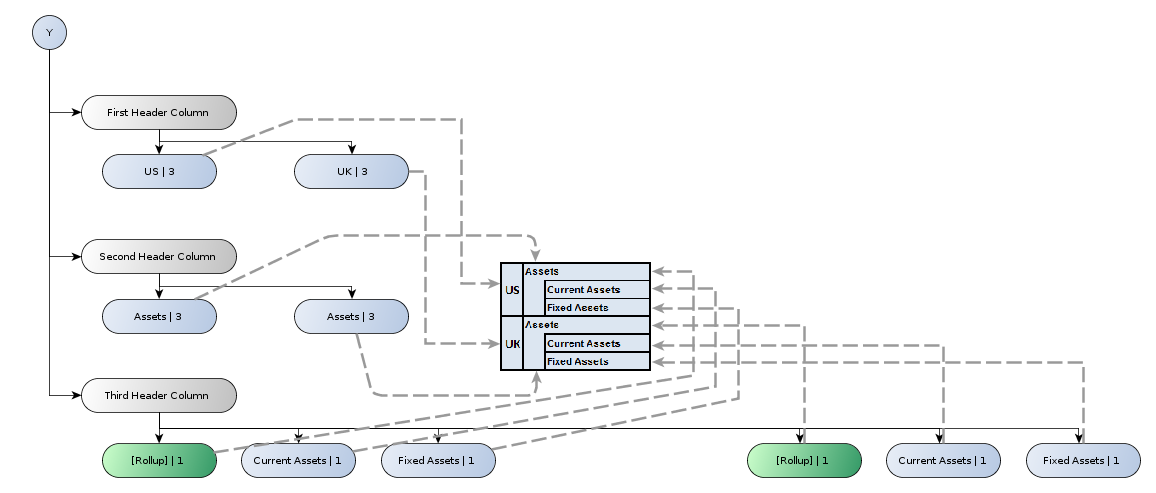
Figure 3 illustrates the tree of axis nodes for the x-axis of Figure 2:
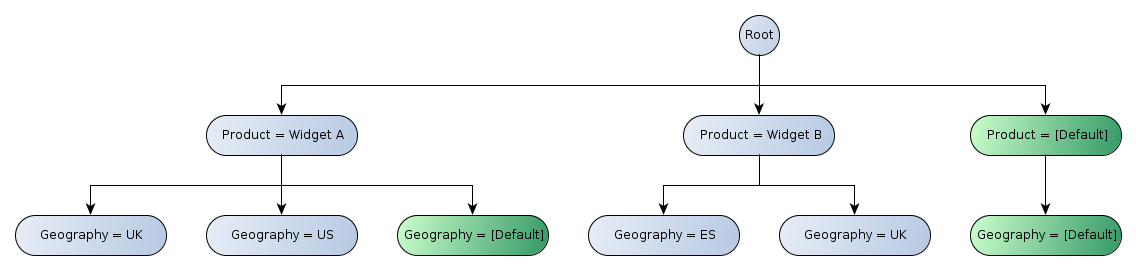
Note the roll-up nodes (indicated in green) in the hierarchy labelled "[Default]", which have the following properties:
- Cells in the row or column will identify facts which are not reported against the specified dimension (and therefore imply the default value).
- It will typically be rendered using spanned cells to form an "L-shaped" arrangement in the header. While this style of rendering may be typical, it is not a requirement.
It is possible to have a roll-up node which does not specify a default value, or a non-roll-up node which does specify a default value, but roll-up and default values are most often used together. See Section 3.1.1.2 for more detail.
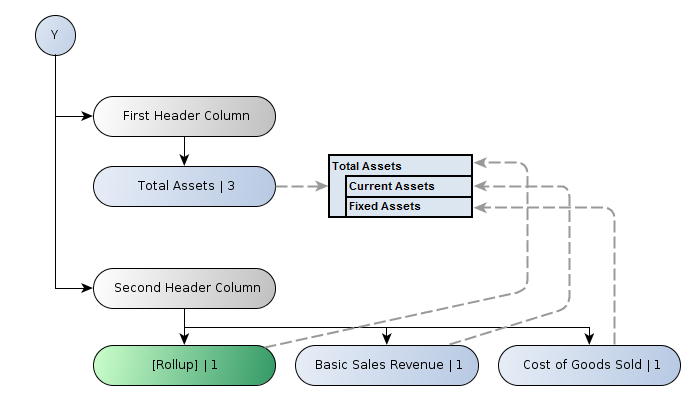
Figure 4 illustrates the tree of axis nodes for the y-axis of Figure 2:
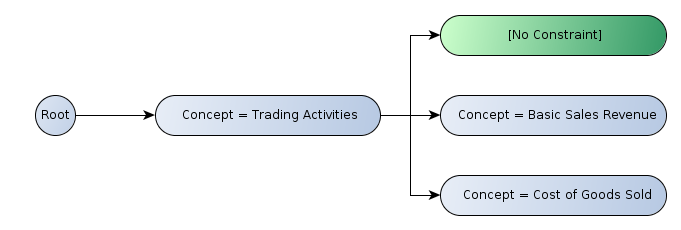
Note, the node labelled "[No Constraint]". While this node contributes no constraints itself, it exists to contribute a row to the table (by virtue of the path it contributes to the tree).
Since this node contributes no constraints, the "Trading Activities" aspect value constraint for the concept aspect applies to all cells in the row. In contrast, the other leaf nodes in this example constrain the value of the concept aspect, which will take precedence over the "Trading Activities" aspect value constraints defined by the parent node.
It is worth noting the difference between the trees of a single aspect (in this example, the concept aspect on the y-axis), and trees of multiple aspects (in this example, dimension aspects on the x-axis). For trees of a single aspect, the roll-up node will not define an aspect value, since this is already defined by the parent. For trees of multiple aspects, the roll-up node will define an aspect value for the aspects which appear in its siblings.
3.1.1.1 Cells
The structural model contains no data (see Figure 1), but it does define the shape of the cell matrix which will be populated in the layout model.
A single cell, being at the intersection of a single row, single column and single point on the z-axis, can be associated only with facts which satisfy the constraints of the row, column and point on the z-axis. For data presentation, the constraints for a cell identify the subset of the input facts that should be displayed in the cell. For form entry, the constraints for a cell must be satisfied by any fact entered into the cell.
It is possible for multiple facts to be associated with a given cell. The way this is rendered is implementation defined. For example, if a cell contains multiple facts differing only by language, a rendering implementation may use the locale to select the most appropriate fact.
3.1.1.2 Roll-up
It is common for financial tables to contain "roll-up" columns or rows; for example, to display aggregate values. In XBRL, such values are commonly reported against the default value for a dimension, e.g. a dimension that breaks down data by geographical region might have a default member of "World".
By way of example, let us assume there is an instance that has the following facts:
| Concept | Dimensions | Value | ||
|---|---|---|---|---|
| Product | Geography [Default = World] | Channel [Default = All] | ||
| Sales | Widget A | UK | B2B | 294 |
| Sales | Widget A | US | B2B | 354 |
| Sales | Widget A | — | B2B | 939 |
| Sales | Widget A | UK | B2C | 112 |
| Sales | Widget A | US | B2C | 645 |
| Sales | Widget A | ES | B2C | 284 |
| Sales | Widget A | — | B2C | 750 |
| Sales | Widget A | UK | — | 406 |
| Sales | Widget A | US | — | 999 |
| Sales | Widget A | ES | — | 284 |
| Sales | Widget A | — | — | 1,689 |
| Sales | Widget B | — | B2B | 492 |
| Sales | Widget B | — | B2C | 306 |
| Sales | Widget B | — | — | 798 |
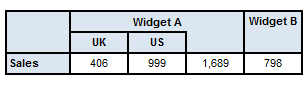
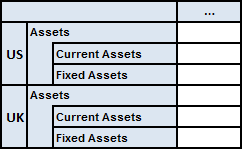
It is useful to first consider a simple table without a roll-up column:
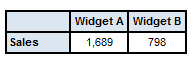
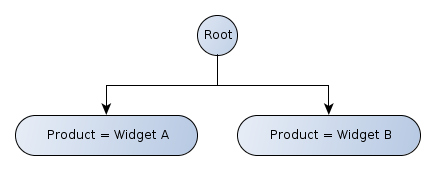
Cells in the first column contain facts reported with Widget A as the value of the Product dimension and no values reported for the Geography and Channel dimensions. Cells in the second column contain facts reported with Widget B as the value of the Product dimension and, again, no values reported for the Geography and Channel dimensions. As both of the unreported dimensions have default values that represent a total (World for Geography and All for Channels), the first column will contain totals for Widget A and the second column totals for Widget B.
Extending the above example to include a drill-down for the Geography dimension, and a roll-up column:

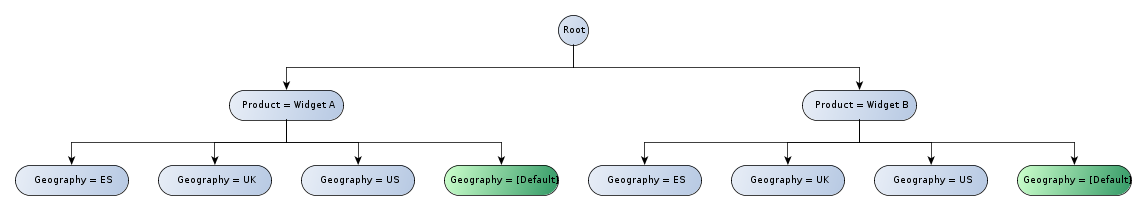
The roll-up columns now contain the facts that appeared in the two columns of Figure 6, i.e. the first roll-up column will contain facts with a value of Widget A reported against the Product dimension, that are not reported against the Geography and Channel dimensions (i.e. with inferred values of World and All).
To illustrate this further, consider the following alternative example, where only Widget A has been broken down by Geography (since there are no facts reported against the Geography dimension for Widget B), and ES has been omitted from the drill-down despite having facts reported against it:
Note that the roll-up columns still contain totals over all (non-default) values of the Geography dimension (i.e. with an inferred value of World), even though not all members of that dimension are included in the table.
Extending the example further to include a drill-down for the Channel dimension (to save space and to illustrate that they are interchangeable, the x and y axes have also been swapped):
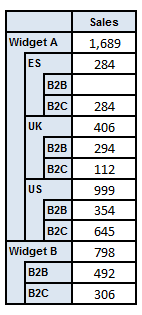
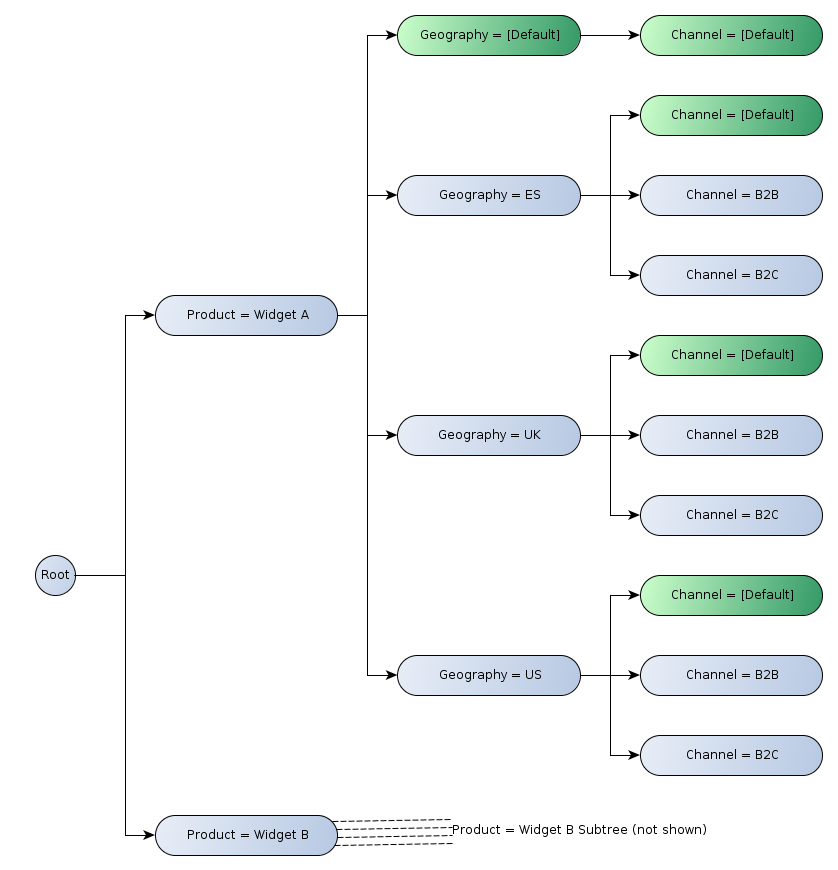
There are now five roll-up rows (four of which are shown in the tree). The first row contains facts with Widget A reported against the Product dimension, that are not reported against the Geography and Channel dimensions. It thus represents totals over all geographical regions and channels. The second row contains facts with Widget A reported against the Product dimension and ES reported against the Geography dimension, that are also not reported against the Channel dimension. It represents totals over all channels for a particular geographical region.
3.2 Table sets
As defined in Section 3.1, the structural model defines fixed axes for a given table. It is desirable to be able to define a series of tables with a single definition, even where the shape of each table depends on the position in the series.
A table set indicates a sequence of closely related tables with a common definition. For example, it is possible for a single definition to resolve to a different table for each extended link role (ELR):
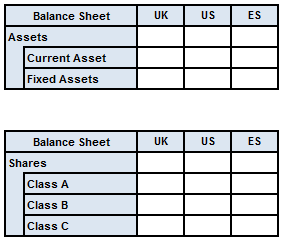
These two tables form a single table set despite having a different y-axis, since they result from the same definition.
4 Definition model
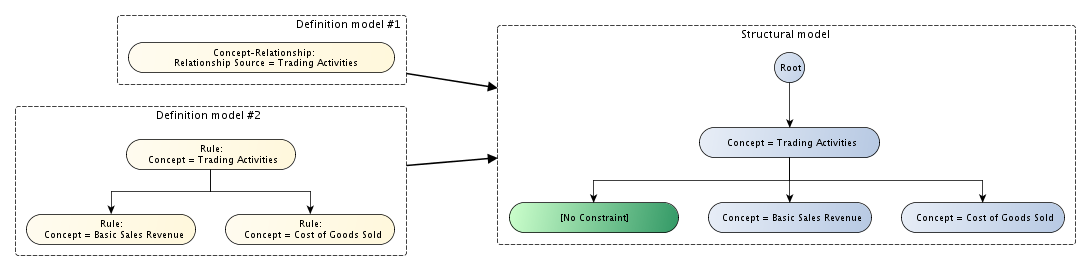
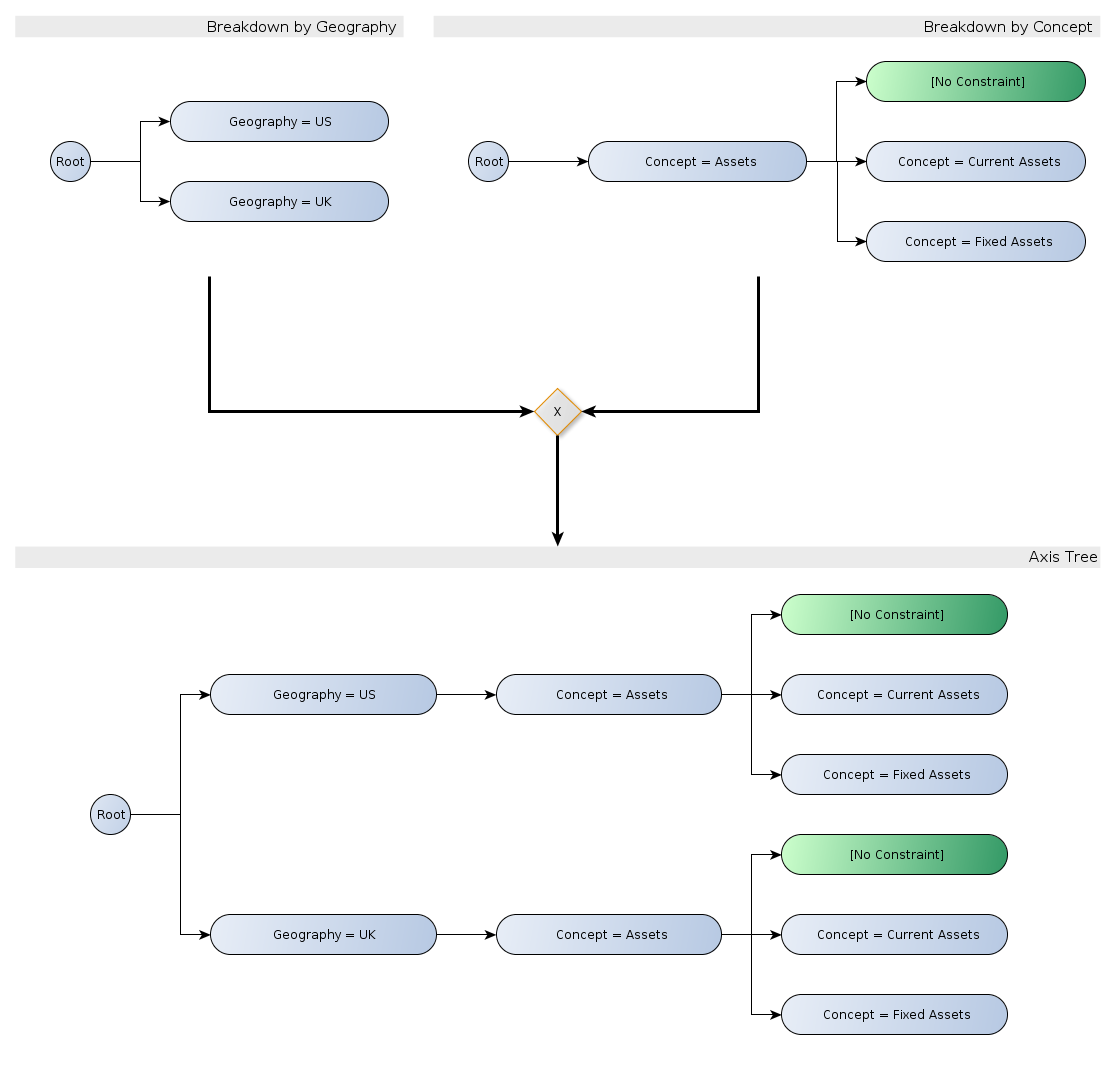
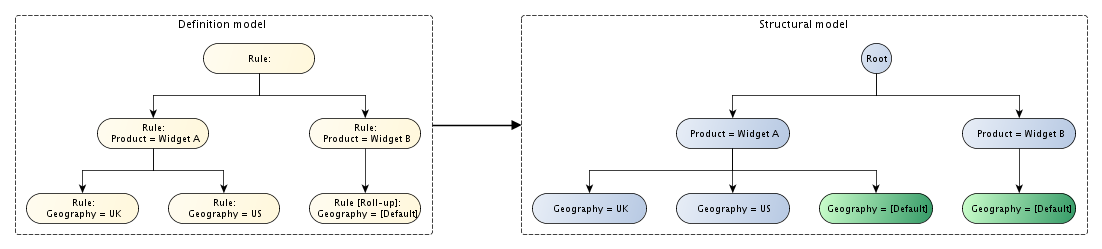
The definition model is a model of the semantic content of the table linkbase. Many of the structures in the definition model correspond directly to elements of the structural model. Tables are defined by their axes and axis definitions are in turn composed of trees of definition nodes. However, there may be several ways to define a given structural model. For example, concepts can be enumerated explicitly, or discovered by following a network of relationships in the instance's DTS. To take a concrete example, in Figure 15, two definition models for an axis resolve to the same structural model.
A table linkbase may contain references to elements from the DTS of the instance, in the form of concept and dimension QNames and URIs representing extended link roles. However, the definition model can be constructed without resolving such references. In some cases, the shape of the final table may be fully determined without reference to either the instance or its DTS.
Although it represents the content of the table linkbase on a semantic level, the definition model is independent of the syntax used; in particular, it does not rely on the table being expressed in terms of the XLink-based syntax described in the specification.
4.1 Definition nodes
Axes are defined by trees of definition nodes. An definition node may expand to several nodes in the structural model.
4.1.1 Types of definition node
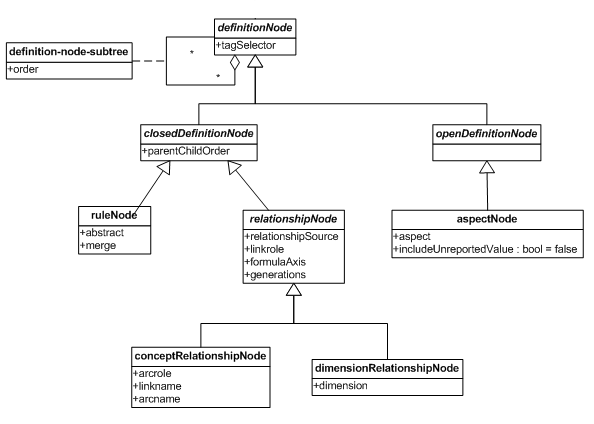
Figure 16 shows the types of definition node defined by the table linkbase specification and their relationships to each other.
4.1.1.1 Rule node
Rule nodes express their constraints in terms of aspect rules, in the sense defined by the formula specification [FORMULA]. An aspect rule constrains the value of a certain aspect to a specific value. A single rule node addresses zero or more aspects, and specifies exactly one value for each aspect addressed.
A rule node defines a single node in the structural model. Child nodes are defined explicitly by child definition nodes. A rule node may be abstract; non-abstract rule nodes contribute an additional child in the form of a "roll-up" node, as described in Section 3.1.1.2.
4.1.1.2 Relationship node
Relationship nodes cover a single aspect and use networks defined in a DTS to discover values for the aspect and arrange them for display. Two types of relationship node are defined:
- Concept-relationship nodes cover the concept aspect. A typical use for such a node would be to arrange concepts hierarchically according to the logical structure defined in the presentation network.
- Dimension-relationship nodes cover a specified explicit dimension aspect. They can be used to arrange the members of a dimension according to the hierarchy of domains defined in a dimensional relationship set (DRS).
A relationship node defines an entire tree of nodes in the structural model. Each concept or domain member contributes at least one node to the structural model. Abstract concepts and domain members that are unusable contribute only a single (branch) node, which acts as a parent for their children. Non-abstract concepts and usable dimension members contribute an additional, roll-up node, thus reserving a row/column in the rendered table.
Relationship nodes can be customised by specifying the network to traverse, a starting resource (concept, dimension or dimension member), and details of how to traverse the network.
4.1.1.3 Aspect node
Aspect nodes are open definition nodes. An aspect node specifies a single aspect and optionally restricts the acceptable values of that aspect using filters, as defined by the formula specification [FORMULA]. Unlike rule nodes, aspect nodes do not require the values of the aspects being referenced to be known in advance. An aspect node can be used to e.g. break down facts by the members of a dimension actually in use in an instance.
4.2 Resolution
Resolution is the process of transforming the definition model into a structural model for the table. This will generally require the DTS of the instance (either an existing instance or, if the table is to be used for data input, the DTS of the target instance). It does not, however, require knowledge of the instance itself.
As described in Section 4.1.1.2, the process of resolving the definition model involves expanding some types of definition node (e.g. relationship nodes) into a tree of structural nodes. At this point, it is necessary to reference the DTS of the instance. The DTS is also necessary to identify concepts, dimensions and explicit dimension members, which are defined in the taxonomy.
4.2.1 Open vs. closed nodes
Some definition nodes can be expanded to a complete tree of nodes without the need to refer to an instance. Nodes in the structural model that are defined in this way are termed 'closed' nodes and define the static structure of the table. Other definition nodes cannot be fully expanded without knowledge of the instance to be rendered. As an example, consider a table with one column for each period for which facts are reported in the instance. This is achieved using an aspect node that selects all values of the period aspect. Knowledge of the instance is required to enumerate the periods actually used in the instance. Furthermore, if the table is being used for data entry, enough information needs to be available from the structural model for a tool to be able to dynamically create rows or columns, based on the periods (in this example) entered by the user. Nodes defined in this way are termed 'open' nodes and define dynamic regions of the table.
A closed table is a table whose axes consist only of closed nodes. The shape of such a table is entirely static and independent of the data being displayed. An open table involves at least one open node. The shape of an open table can vary dynamically in response to new data being entered.
4.2.2 Table sets
In some circumstances, a single table definition can resolve to a set of related tables which have different shapes, even though they share a common definition. A common case is where an axis is defined that covers different extended link roles (ELRs) and the link role is then used to identify the network to be followed by a relationship axis. Networks with different ELRs may describe a completely different hierarchy of concepts, with some concepts appearing in only one network and others appearing in several, possibly under different parents. For example, the single table definition shown in Figure 17 results in the two tables in Figure 14.
5 Layout model
The layout model represents the rendered output. Whereas the definition model reflects the way the table structure is specified by the table linkbase author and the structural model represents the fundamental semantics of the table, the layout model mirrors the shape of the table as rendered in the output.
Figure 18 shows a rendered table:
The layout model contains both the headers and the data that appear in the rendered output.
There are a number of different structural models which could produce this rendered output, and a number of definition models which could result in each of those structural models. We can however, determine the layout model from the rendered output:
Each axis header is arranged into header rows (or header columns for the y-axis) consisting of header cells. Each header cell has a span (indicated in Figure 19 and Figure 20 by a number after the label), an optional label, and an indication of whether or not it should be merged with the header cell directly above it (or to the left of it for the y-axis).
The span for a header cell indicates the number of columns (or rows) it occupies. The sum of the span values for all header rows in the same header must be equal.
A header cell marked as a roll-up cell is semantically part of the cell directly above it. As such, this will typically be indicated by omitting the border between the two header cells.
The data is specified in the layout model as a three-dimensional matrix.
5.1 The layout process
The layout process is the process of transforming the structural model into a layout model. The process can be divided into four steps:
- expanding open nodes
- projecting breakdowns onto axes
- constructing the table axis headers
- populating the table cells
5.1.1 Open node expansion
Open nodes (see Section 4.2.1) are those that cannot be fully expanded without knowledge of the instance. These must be expanded during the rendering process. For output, this means including rows and columns to accommodate the data in the instance. For data input, the tool must provide some way for the user to enter new data, and accommodate this by dynamically adding columns and rows as necessary at run-time.
5.1.2 Projection of breakdown trees onto an axis
The breakdowns in the structural model are projected onto the axes of the table, resulting in a single axis header in the layout model for each axis.
A single axis may be composed of multiple breakdown trees. Where this is the case, the cross-product of the constraint sets defined by the trees is taken, which yields a single constraint set for each column:
The tree resulting from this cross-product is not part of any model, but it is a logical step in producing the layout model from the structural model.
5.1.3 Constructing headers
The table axis header corresponding to a tree of nodes can be constructed by creating a row in the header for each level in the tree. Each row in the header should contain a header cell for each closed node, and a number of header cells for each open node.
For example, the tree shown in Figure 22 results in the layout model in Figure 23:
The header cells in the layout model corresponding to a node in the structural model are labelled according to the labels associated with the node.
5.1.4 Populating data
The final step in the layout process is to populate the cells of the table with values. Facts which match the constraints of a cell are considered for rendering in that cell. Multiple facts may match a single cell, and how this is handled in the rendered output is implementation defined.
The facts may originate from an input instance, or may be created dynamically by the tool as directed by the user.
6 Examples
6.1 Simple example
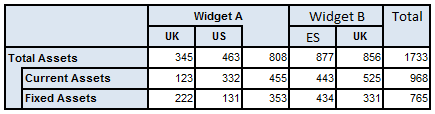
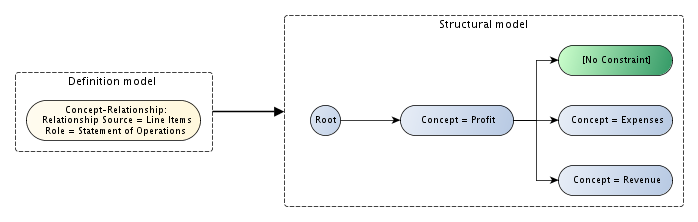
Figure 24 gives an example of a simple table in which concepts are displayed in a tree on the y-axis (rows) and the x-axis (columns) breaks down the reported facts by dimension. In this case, facts are initially broken down by the Product dimension; data for Widget A is further broken down by the Geography dimension (perhaps because only Widget A is sold in multiple regions), with a roll-up column to display the total for all regions.
As shown in Figure 25, the x-axis is defined in terms of rules that explicitly select values for each dimension. Each rule node defines a single node in the structural model (with the exception of the root definition, which exists only as a container). An implicit roll-up node is required as a child of the node 'Product = Widget B', to balance the tree and reserve a column in the rendered table.
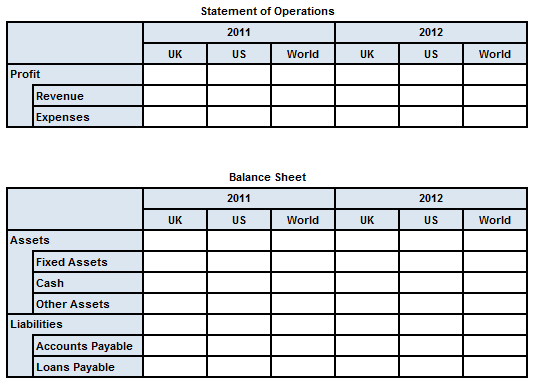
The definition of the y-axis is very simple, consisting of a single definition node (see Figure 26). This is possible because the concept-relationship node instructs the processor to use a network defined in the DTS to discover concepts and arrange them on the axis. In this case, a network with a link role of 'Statement of Operations' is used; the starting concept, 'Line Items', is not itself included in the structural model, but this behaviour is configurable). An arcrole, not shown here, is also necessary to fully determine the network.
6.2 Example using multiple breakdowns
This example extends the simple example in Section 6.1. Figure 27 shows a table in which the y-axis is defined as in the previous example (see Figure 26), but the x-axis breaks down the data by every combination of the Period and Geography dimension. This can be thought of as two separate breakdowns, combined by taking their cross-product.
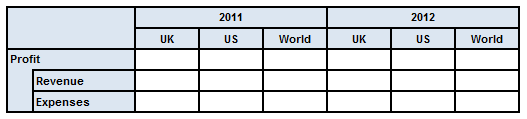
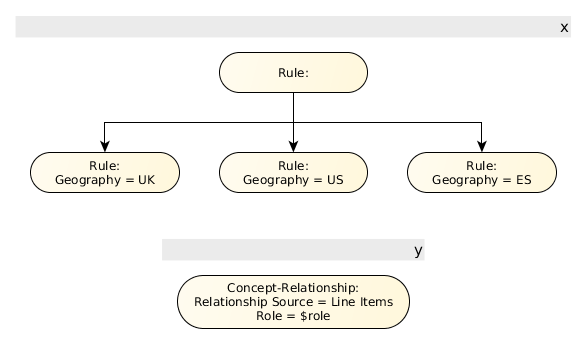
Figure 28 shows the definition and structural models for the x-axis of the table in Figure 24. The axis is defined in terms of two separate breakdown trees; the first selects two periods from the instance, while the second defines explicit values for the Geography dimension. In the rendered table, the two breakdowns are combined in a cross-product.
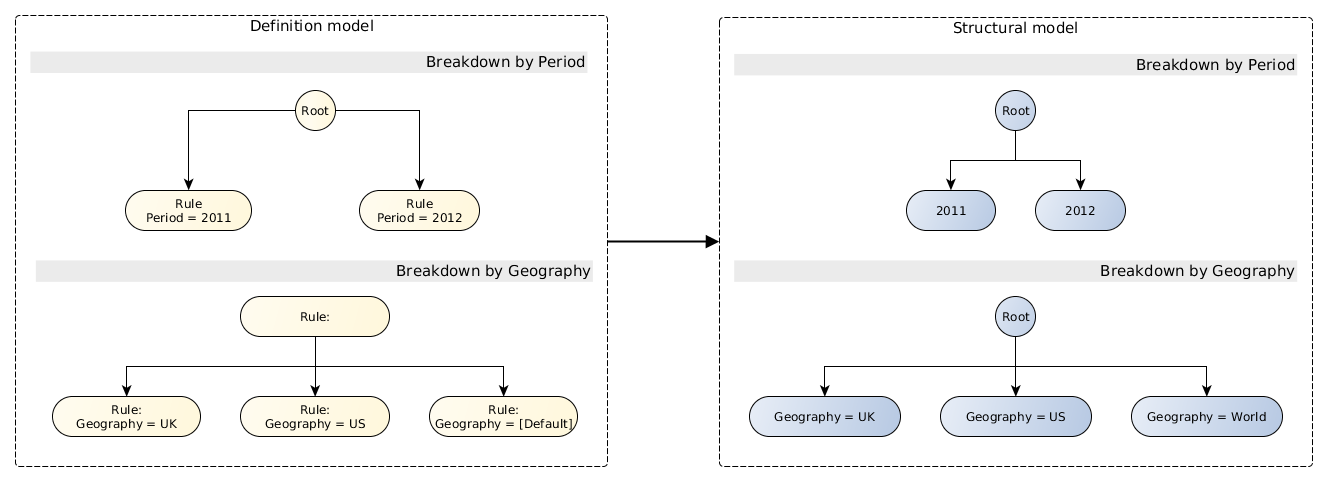
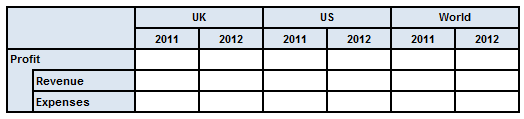
Note that the entire x-axis could have been defined using a single tree containing only rules, as in the previous example. Using separate breakdowns allows a more concise definition, while embodying the semantics of breaking down the data by two independent variables. A tool may use this information to allow the user to 'pivot' the different breakdowns; for example, in some situations, it might make more sense to break down the data primarily by the Geography dimension, with Period forming a secondary breakdown, as shown in Figure 29.
6.3 Example of a table set
This example extends the example in Section 6.2 by using a single table definition to create a set of related tables. Each table shown in Figure 30 corresponds to a different link role. The x-axis is defined as in the previous example (see Figure 28).
The table in Figure 30 uses a table
parameter to select different link roles, resulting in a set of different
2-D tables. Link roles are selected from the taxonomy and bound in turn
to the $linkrole parameter, which then determines which
network is used to populate the y-axis with concepts (see below).
Figure 31 shows the definition and structural models for the y-axis of the table in Figure 30. Although the y-axis has a different shape for each table, all the tables share a single definition. Different structural models result from traversing different networks of concepts, according to the link role set by the table parameter.