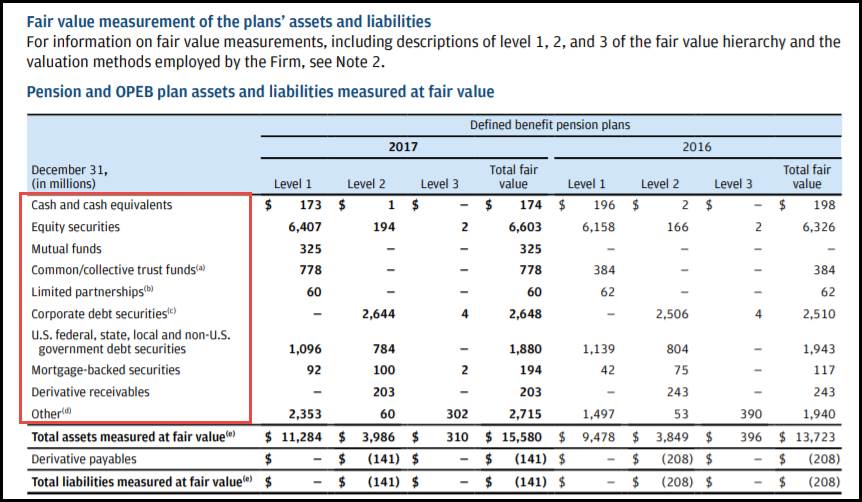
 Figure 1: Asset class breakdown
The XBRL 2.1 Specification defines a standard XML-based syntax for XBRL business reports. It provides a syntax for defining calculation relationships (hereafter XBRL 2.1 summation-item) between numeric items in an XBRL report.
XBRL 2.1 summation-item relationships have defined validation behaviour, with conformant processors being required to signal an "inconsistency" if the facts in an XBRL report do not conform to the prescribed relationships. The validation behaviour does not include any provision for inferring values which are not explicitly reported.
XBRL 2.1 summation-item relationships are restricted to describing summation relationships between numeric facts which are c-equal, that is, which share the same period, dimensions and other contextual information, among other restrictive conditions.
Calculation relationships are also a useful mechanism for declaratively modelling simple mathematical relationships between concepts in a reporting taxonomy.
In practice, the modeling and validation use cases are often in conflict, as the desire to avoid calculation inconsistencies being reported may require calculation relationships to be altered, or removed altogether.
This document provides requirements for an expansion to the calculations features of XBRL to:
Calculation relationships can be used to support for the following use cases.
Data consumers rely on the explicit relationship structure of data, among other things, to understand the semantic content of the data. A critical relationship structure for financial data is the mathematical relationships between concepts. Data consumers rely on these relationships to identify how concepts aggregate and disaggregate, in order to ensure that they can select the right concept for their applications and not miss or double count data.
Complete and consistent calculation relationships between concepts in a taxonomy allows data consumers to understand how concepts are intended to roll up from more granular to more summarized concepts. This allows data consumers to trust that they are selecting the right concept.
It also allows data consumers to reliably infer summarised values that are not explicitly reported from more granular data. For example, data may be reported for various disaggregations of revenue, and a data consumer may want to use total revenue in their analysis.
Creating a complete and consistent calculation relationship structure in a taxonomy also allows data consumers to validate the facts associated with reported concepts, ensuring that the data they use is mathematically correct.
Data preparers must ensure they are selecting the correct concepts for their regulatory reporting requirements. Using a taxonomy with complete and consistent calculation relationships allows data preparers to understand how concepts relate to each other, assisting preparers to select concepts that are consistent with their reports.
Complete and consistent calculation relationships allow data preparers to validate the mathematical accuracy of their reports, and can assist in ensuring the completeness of tagging and that facts are tagged with the correct sign.
It must be possible to define calculation relationships that correspond to XBRL 2.1 summation-item relationships (i.e. summation and subtraction between facts of different concepts), but with updated behaviour that supports the other requirements described here (e.g. support for calculation of intermediate subtotals).
Concept roll up calculations need only support addition and subtraction; they do not need to support weighted addition and subtraction (weights other than +1 and -1).
Concept roll up calculations should apply between facts with the same aspects and aspect values (as defined in OIM) except for the concept core aspect.
Note that for the purposes of determining which facts concept roll up calculations should be applied between, a typed dimension with a nil value should be considered different to the absence of that dimension.
It should not be possible to create concept roll up calculations:
xsd:float or xsd:double.It must be possible to define calculation relationships between a hierarchy of domain members.
Dimensions are used for aggregating and grouping. Other dimensions may be used to identify non-summing attributes such as legal entities.
It must be possible to easily re-use existing domain-member hierarchies for calculations.
It is not necessary to support calculations between domain members that are not defined in a domain-member hierarchy. Any requirement to do so could be met by creating a domain-member hierarchy explicitly for that purpose, as unless it is linked to a hypercube it has no impact on dimensional semantics.
The example below shows pension plan obligations that are dimensionally aggregated by pension plan name, modelled using an explicit dimension.
Table 3: Pension use case (dimensional relationships)
| Total | RetirementPlanNameAxis | |||
| PlanAMember | PlanBMember | PlanCMember | ||
| DefinedBenefitPlanBenefitObligation | 800 | 100 | 200 | 500 |
A dimension may have more than one domain hierarchy associated with it. This implies a need for segregated domain-member hierarchies.
The examples below show two alternative breakdowns for a "defined benefit plan by asset category" dimension. The breakdowns have some members in common. Although in this case, the concepts involved are different, this may not always be the case.
Figure 1: Asset class breakdown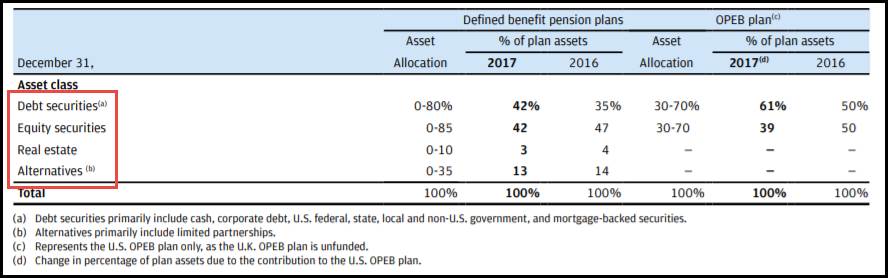 Figure 2: Alternative asset class breakdown
A dimension may apply to multiple concepts, some of which can be aggregated, and some of which cannot.
It must be possible to perform aggregation across a domain-member tree that applies to concepts with multiple data types, some of which are aggregatable (e.g. monetary) and others which are not.
The example below is an extract of “Schedule of continuity of finder's options disclosure”. The dimensional aggregation for “FiAxis” is applicable only for the concept with 'Shares' datatype (Last column). Aggregation of the first two columns does not make sense, and processors should not attempt to infer a total for these columns.
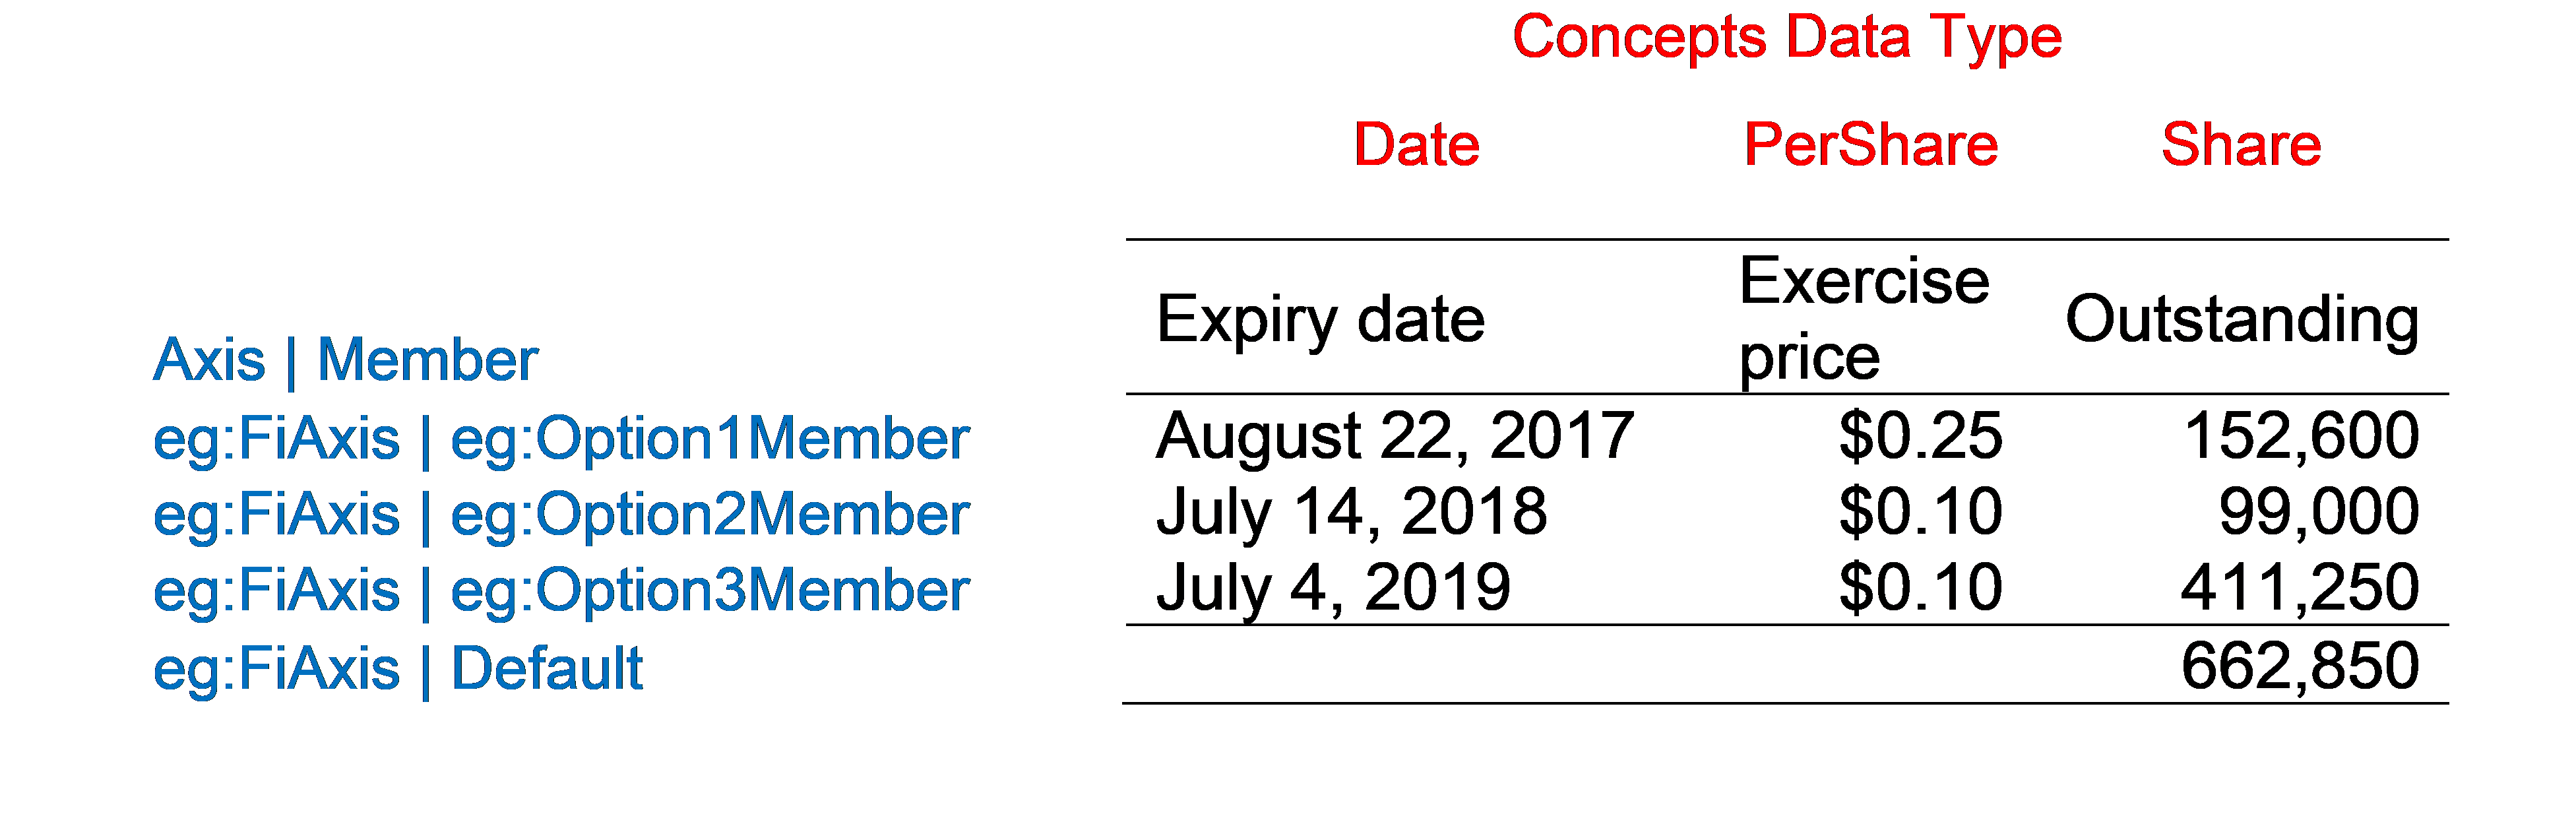 Figure 3: Options Example
Non-numeric concepts (e.g. date) are not aggregatable. Numeric concepts should be aggregatable by default, but there should be a mechanism for indicating that a concept is non-aggregatable.
There are some cases where it is not a simple property of a concept. In the example in Figure 4 (taken from Abbot Laboratories 2018 3rd quarter filing, page 3), earnings per share for continuing and discontinued operations can be aggregated to get total earnings per share for a given class of share, but it would not make sense to aggregate earnings per share across share classes.
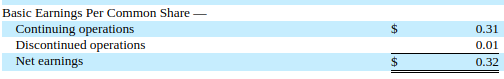 Figure 4: Earnings per share can be aggregated across continuing and discontinued operations
For another example, see page 105 of Citigroup 2017 annual filing, page 105. "Average volume" and "Interest revenue" can be summed over region (row 4 = row 2 + row 3) but "Average rate" cannot be.
Some dimensions can never be aggregated. Aggregation should only be performed where a calculation indicates that a dimension is aggregatable across a specified domain.
One example of a dimension that can never be aggregated is the use of a "range" dimension to capture a fact that is reported to be with certain bounds. For example, the disclosure shown below (taken from Wendy's 2017 annual filing, page 78) reports costs to be within a speicified range.
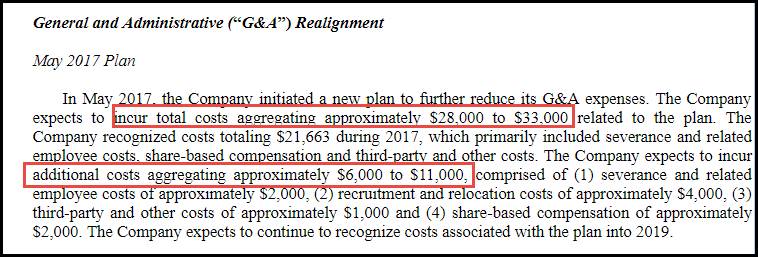 Figure 5: Range disclosure
This is modelled using "minimum" and "maximum" members on a range dimension, as shown in Figure 6.
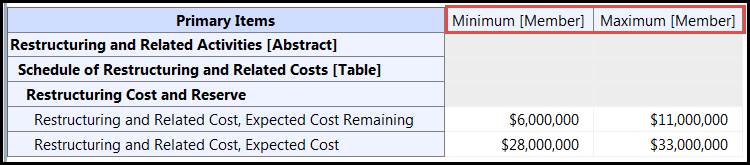 Figure 6: Range disclosure modelling
It must be possible to perform aggregation across a typed dimension. It should be possible to specify the following aggregation modes for a typed dimension:
Aggegration to a typed dimension with a nil value is out of scope (see Section 5.4).
Segment reporting modelled as a Typed Dimension. The geographical breakdown is reported with a typed member. The aggregation value reported as non-dimension fact. (Example from ACRA, Singapore Taxonomy)
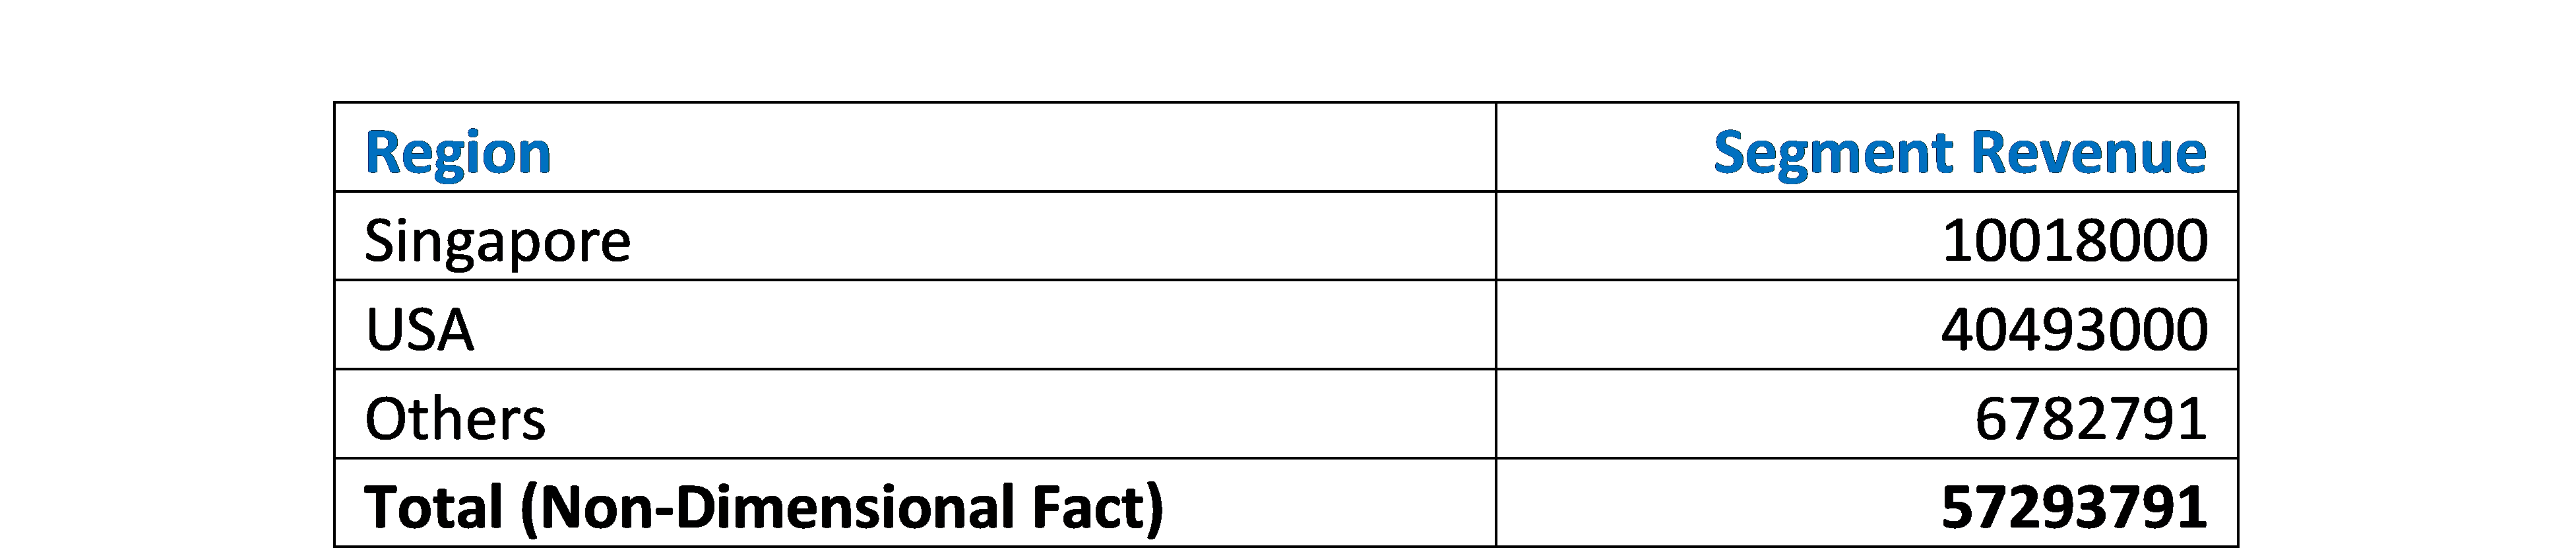 Figure 7: Segment Reporting Example
Break-down of non-current investments is modelled as a typed dimension. Each investment detail is reported with a typed-member, and the total(highlighted) is a non-dimensional fact. (Example from IND-AS, India Taxonomy)
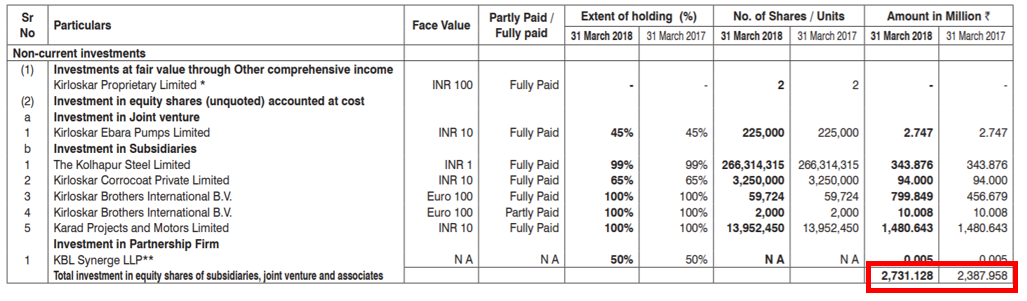 Figure 8: Non-Current Investments Reporting Example
It must be possible to define calculation relationships between an opening balance, a set of in-period changes (which may make a positive or negative contribution), and a closing balance. For example, a fixed asset balance roll forward may be required to show a beginning balance, additions and disposals during the period, and an ending balance (see Section 3.1.4.3).
The opening and closing balance will be modelled using the same concept (with an "instant" period type), and the change items will have "duration" period type.
The calculation should be appled wherever the two facts for the balance concept are present with periods that coincide with the start and end date of one or more of the change items (or, a value can be inferred for one such an item).
Roll forwards calculations need to support positive and negative contributions, but not weighted contributions (weights other than +1 and -1).
Roll-forward calculations should be applied where duration values can be inferred from a set of consecutive shorter periods. For example, inferring the value for a year duration from the sum of four consecutive quarters.
The following table shows example concepts, facts and periods for a typical roll-forward calculation.
| PropertyPlantAndEquipmentGross | 100 | 2015-12-31 |
| PropertyPlantAndEquipmentAdditions | 500 | 2016-01-01 - 2016-12-31 |
| PropertyPlantAndEquipmentDisposals | 50 | 2016-01-01 - 2016-12-31 |
| PropertyPlantAndEquipmentGross | 550 | 2016-12-31 |
The figure below shows the alignment between instant (balance) facts, and duration (change) facts to which roll-forward calculations would be applied:
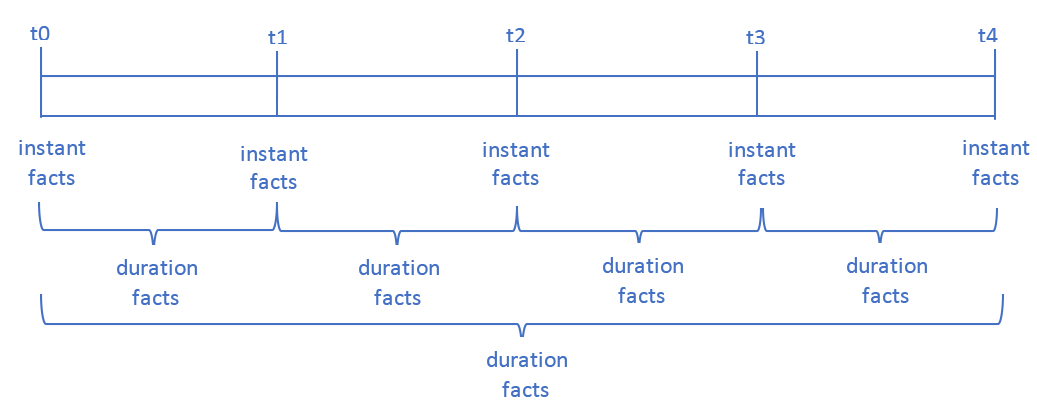 Figure 9: Timeline
It must be possible to define calculations that are a combination of the above types.
The combinations may have subtotals of items which are aggregated by one method that accumulate into another method, such as dimensionally broken down items which subtotal to the dimensional aggregate which sums with summation items.
It must be possible to support such calculations, even where the intermediate sub-total is not reported.
The following table is representative of equity statement entries, which aggregate as well as sum. Fact items of the CommonStockValueOutstanding concept are dimensionally broken down by stock class and must be aggregated to participate in the stockholder's equity sum. There is no total reported for CommonStockValueOutstanding. For this reason the concept roll up calculation for StockholdersEquity uses the computed total from the dimensional aggregation of StatementClassOfStockAxis, both for modeling and to enable report validation.
| StatementClassOfStockAxis | |||
| CommonClassAMember | CommonClassBMember | ||
| 12/31 | Class A | Class B | |
| CommonStockValueOutstanding | 100 | 500 | |
| AdditionalPaidInCapital | 100 | ||
| AccumulatedOtherComprehensiveIncome LossNetOfTax | 50 | ||
| RetainedEarningsAccumulatedDeficit | 200 | ||
| StockholdersEquity | 950 | ||
This filing aggregates satellite and non-satellite breakdown of Property, Plant and Equipment into Assets with an inferred dimensional breakdown total:
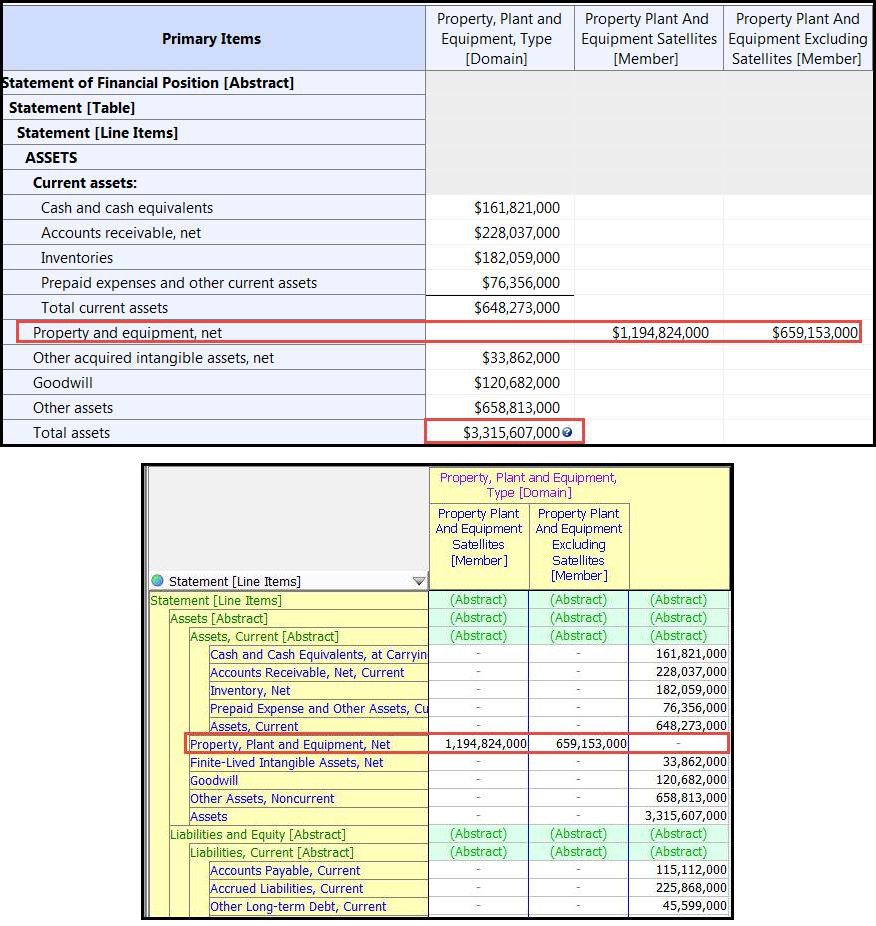 Figure 10: Equity breakdown
Figure 11 shows a table of derivative values, broken down across three dimensions.
The primary dimension for the rows is A1 ("DerivativeInstrumentAxis"). The value for the "Options" member on this dimension is broken down by a second dimension, A2 with members "Written" and "Purchased". The total for this dimension is not explicitly reported; the values for the members roll up into the "Total interest rate contract notionals" figure.
This calculation can be represented by a dimensional aggregation for A2, which allows values for the ExM11 ("Options") member to be inferred from the two rows below, and a second dimensional aggregation for A1 which uses that calculated total in the calculation for "Total derivative notionals".
The columns are represented by a third dimension, A3 ("HedgingDesignationAxis"). An aggregated total is not reported across this dimension, although a dimensional aggregation calcuation could be provide to allow such totals to be calculated.
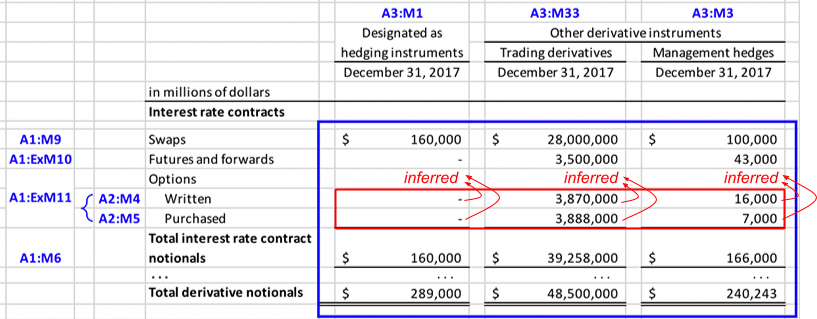 Figure 11: Derivatives example
When processing calculations, inconsistent duplicates should be treated as an error, complete duplicates should be ignored, and calculations involving consistent duplicates should proceed using the value with the most precise value.
XBRL v2.1's summation-item specifies consistency checking that takes into account the stated accuracy of the facts involved. This is done by rounding facts according to their stated accuracy. This approach is flawed, and can lead to calculation inconsistencies in certain edge cases (see Section 5.2 for an example).
A more reliable approach to checking calculation consistency is to consider the intervals represented by reported facts, and the resulting interval on any calculated value, and ensuring that this overlaps with the interval represented by the reported total.
The interval represented by a fact is influenced by the rounding method applied (for example, 1.1 (decimals = 1) is a valid rounding of 1.05 using the half-away-from-zero method, but not under half-to-even). Different jurisdictions, projects or individual preparers may adopt different rounding methods.
Calculation checking should be perfomed using interval arithmetic. It must be possible to specify the rounding method used at the report-level. If specified, it should also apply to duplicates checking.
The default should be to use "generous" intervals, which assume that a half value may be rounded either way (as documented in the Duplicates Working Group Note)
A fundamental challenge with applying calculations in a financial report is identifying where sufficient facts are present in order to correctly calculate an unreported total, or to validate a reported total; if not all contributing items to a calculation defined in a taxonomy are included in a report, should they be assumed to be zero or unknown?
In the example below (taken from Apple 2018 annual filing), the [balance sheet][apple-filing#s89D18B6BECA751588D8AD93C418ED353] (page 40) includes "total current assets" which is the sum of a number of items including "cash and cash equivalent". Facts for this items in this calculation are provided for balances at the end of two periods: 2017 and 2018.
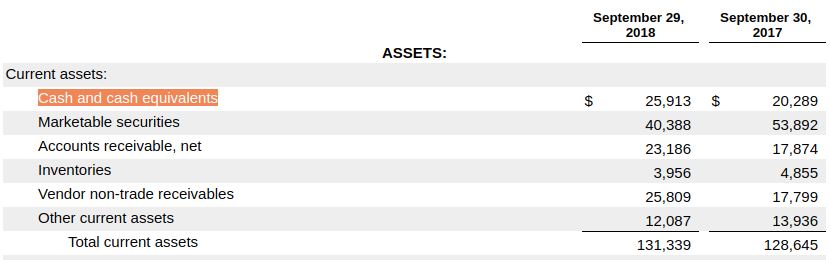 Figure 12: Cash and cash equivalents reported on balance sheet
The statement of cash flows (page 42) includes the same values for cash and cash equivalents, and some additional values as balances of the beginning of 2018, 2017 and 2016.
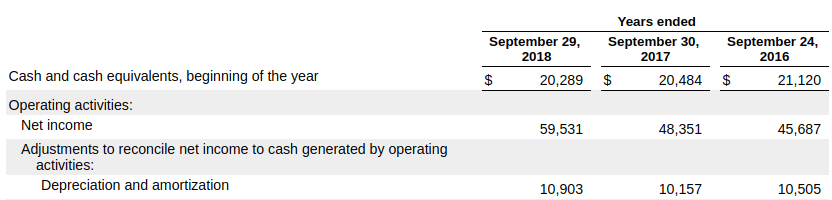 Figure 13: Cash and cash equivalents reported on cash flow statement
It is clear that in this case, a consumer should not attempt to infer a value for total current assets in these additional periods on the assumption of all other contributing items being zero; the calculation for total current assets is incomplete in these additional periods.
A human reader of a financial report will infer the completeness of a calculation based on the presentation of the figures within a table. It must be possible for a report preparer to indicate that sets of facts form a "section" for the purposes of associating them with, and asserting that they are complete with respect to, relevant calculation relationships.
Nil values should be interpreted as being an unknown value. This means that a calculation involving a nil fact cannot be performed, and attempting such a calculation should result in an error.
Values that are immaterial should be tagged as zero to an appropriate accuracy (i.e. "zero to the nearest million")
Calculation relationships can be used to define a hierarchy of calculations; a contributing item for one calculation may be the total of another calculation ("an intermediate subtotal").
It must be possible to validate a calculation even when not all intermediate subtotals are present. A processor should attempt to obtain a value for such items using the calculations defined for them.
This functionality would increase the extent to which the calculations defined in a base taxonomy (which will typically contain many levels of subtotals that will not all be included in any given report) can be used for validation.
It will also allow concepts introduced in an extension taxonomy to be linked using a calculation relationship to the closest sub-total in the base taxonomy, rather than the closest reported sub-total, providing useful additional information about the meaning of the concept.
This functionality is also important in order to enable calculations that combine different calculation types (see Section 3.2.1)
The solution should increase the extent to which calculation relationships defined in a base taxonomy can be re-used by an extension taxonomy.
The semantics of XBRL 2.1 summation-item relationships mean that attempts to apply the calculation relationships defined in a base taxonomy to a report will typically result in a large number of calculation inconsistencies. This is for a number of reasons, including:
As a result, current practice is typically for an extension taxonomy to recreate all calculation relationships from scratch, involving only the concepts relating to facts in the report. By addressing the issues noted above, it is anticipated that it should be possible to apply base taxonomy calculations to a report with only modest modification to cope with entity-specific disclosures.
Although re-use, rather than recreation, of calculation relationships is generally desirable, the solution should support either approach.
The @weight attribute on XBRL 2.1 summation-item relationships is constrained by the values of the @balance attributes on the concepts involved in the calculations.
Whilst this balance attribute constraint is generally useful, there are cases where the constraint is not applicable, leading to calculations being omitted from the taxonomy, or balance attributes being removed from concepts in order to avoid the constraint.
The constraint is of particular value in ensuring that calculation weights in an extension taxonomy, and thus the sign of facts in a report, are assigned correctly.
The current calculation weight constraint should be the default behaviour on both concept roll up (Section 3.1.1) and roll forward (Section 3.1.4) calculations, but it should be possible to explicitly disable this check on a per-calculation basis.
It must be straightforward for a data collector to specify filing rules that prohibit or otherwise constrain the use of this feature.
An example of where the balance constraint is an impediment is the accounting equation, Assets = Liabilities + Owners’ equity. This cannot be expressed with XBRL 2.1 calculation relationships because Assets is a debit and the other two are credits.
Another summation example of where the balance constraint is an impediment is in modeling of secured borrowings (FASB US-GAAP taxonomy).
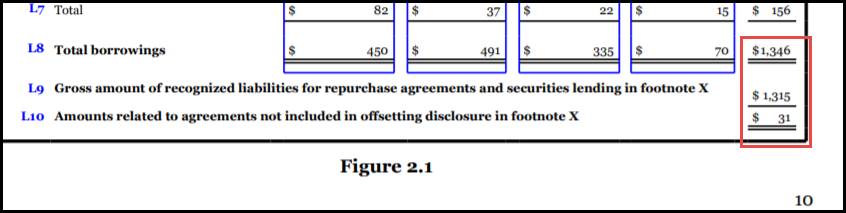 Figure 14: Secure borrowings table
The issue is that all three elements are modeled with credit balance attributes, however the weight for L9 is negative (subtracted from L10), but L9 is a subtraction of from L8 to get to the total of L10.
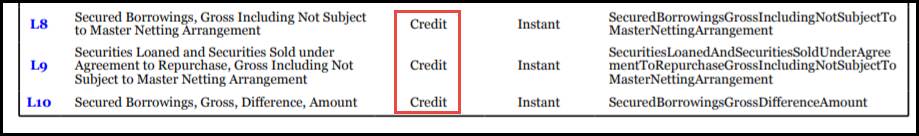 Figure 15: Balance attributes in secure borrowings table
A roll-forward example of where the balance constraint is an impediment is in modeling of goodwill (FASB us-gaap). Note the second and third items, which are both debit attributes, but make opposing contributions to "Period Increase (Decrease), Total".
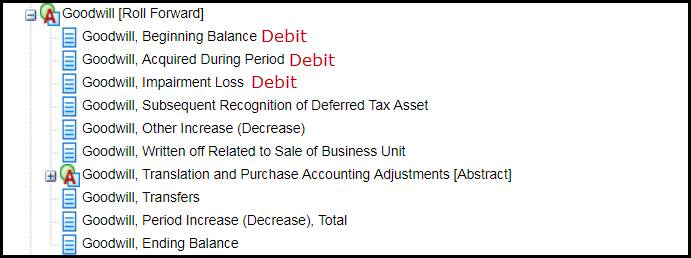 Figure 16: Goodwill table
GoodwillPeriodIncreaseDecrease cannot be a assigned a balance attribute because of the balance attribute constraint.
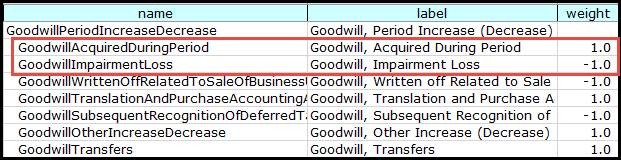 Figure 17: Goodwill concept weights
It must be straightforward for a tool to display to an end-user a simple representation of the relationships between the facts involved in a calculation. This rules out XBRL Formula as a solution to these requirements (see Section 4).
The solution must operate exclusively on the information available in an Open Information Model report, and its supporting taxonomy. It is not necessary to support XBRL reports that are not supported by the Open Information Model (see xBRL-XML constraints).
The XBRL Formula specification already provides the capability to validate the calculation types described in Section 3.1. XBRL Formula rules can also support much more complicated relationships (for example, calculation of an average), and because of this it is much harder to understand (and display to a user) the relationships between facts that are implied by a formula rule.
The following requiremets were considered by the group and deemed to be out of scope.
In addition to the constraints resulting from the requirements in Section 3.8, it is not necessary to support calculations across the entity (scheme and identifier) or unit aspects defined in XBRL 2.1.
The group considered an approach for checking calculations based on the principle that reported values will typically add up exactly, despite being reported rounded to a particular precision. For example, if the values 10.3 + 10.3 = 20.6 were reported to 0 d.p., they would not be shown as the correct, but apparently inconsistent "10 + 10 = 21", but instead one of the contributing figures would be rounded up rather than down in order to achieve "lexicographic consistency".
The group decided to not pursue this approach, as there are counter examples where this approach is not taken. For example, the balance sheet from this IBM 2017 annual report, page 80 does not meet this rule.
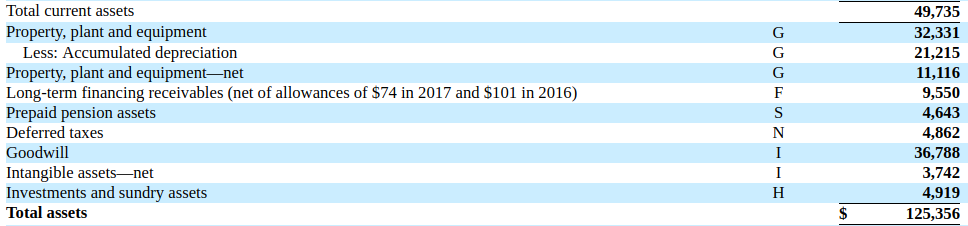 Figure 18: Lexicographically inconsistent balance sheet
The reported total of $125,356m is not the same as the total of the contributing items as shown ($125,355m).
This example also demonstrates the shortcomings of the XBRL v2.1 summation-item approach to rounding when checking calculation consistency, as whilst the reported numbers are clearly consistent to their within their stated accuracy, XBRL v2.1 summation-item considers them inconsistent.
The group considered a number of examples where weighted calculations between members would be necessary as currently modelled.
Following is a sample extract from a risk reporting template. This could be modelled as two dimensions:
The third column (M3) is calculated as the first less the second (M1 – M2), which would imply a need to subtract one member from another.
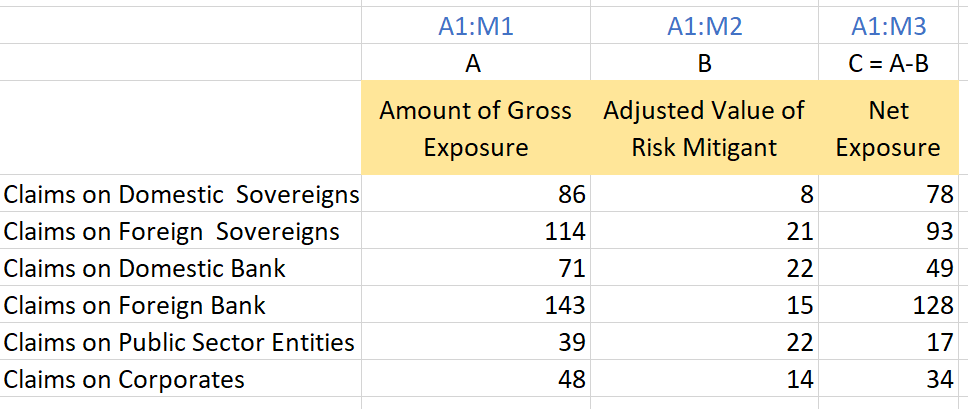 Figure 19: Example of subtraction of values across a dimension
The group was of the view that the preferred modelling of this table would be to have separate concepts (metrics) representing the columns. The columns (Amount of Gross of Exposure, Adjusted Value of Risk Mitigant, Net Exposure) are tightly associated with a datatype (monetary), whereas the rows could be used with a variety of different metrics with different datatypes (e.g. number of claims as well as value of claims)
This example is drawn from capital adequacy reporting templates for the Reserve Bank of India.
In the following example components of an income statement are modelled as a single concept (metric) with a combination of dimension members to differentiate the line items.
The validation required is {r630} = +{r610} - {r620} (rule number v0138_h). i.e. the member value corresponding to row 620 is subtracted to arrive at the total.
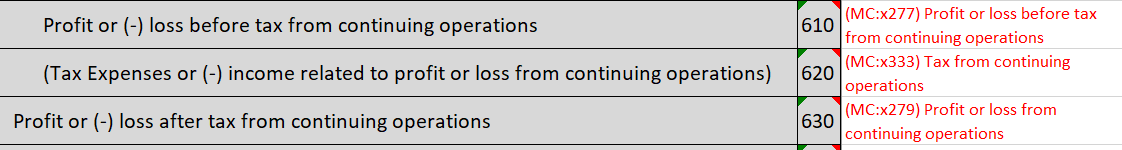 Figure 20: Example of subtraction across a dimension
As for the previous example, the group felt that the rows involved in this calculation would be better modelled as concepts (metrics).
This example is drawn from the European Banking Authorities FINREP (v2.8) reporting templates.
Some implementations use a nil value on a typed dimension to represent a total, but clearer examples are needed to justify including this functionality as a requirement.
The group discussed the possible use of filing indicators for signalling that specific subsets of a report are complete for the purposes of calculation. It was agreed that should be out-of-scope, as filing indicators are associated with tables defined in a taxonomy, rather than specific facts in a report, so completeness issues may still arise.
Filing indicators are primarily used in "closed reporting" environments, whereas the challenges that this updated calculation specification is aimed at addressing are driven by the "open reporting" nature of many financial reports.
XBRL Formula is a widely supported mechanism for applying validation to XBRL reports. The group agreed that it would be beneficial if it were possible to convert calculations expressed using the solution defined here into a form that could be executed directly by a standard XBRL Formula processor, but accepted that this may not be possible (or may require additional extension functions).
This document and translations of it may be copied and furnished to others, and derivative works that comment on or otherwise explain it or assist in its implementation may be prepared, copied, published and distributed, in whole or in part, without restriction of any kind, provided that the above copyright notice and this paragraph are included on all such copies and derivative works. However, this document itself may not be modified in any way, such as by removing the copyright notice or references to XBRL International or XBRL organizations, except as required to translate it into languages other than English. Members of XBRL International agree to grant certain licenses under the XBRL International Intellectual Property Policy (https://www.xbrl.org/legal).
This document and the information contained herein is provided on an "AS IS" basis and XBRL INTERNATIONAL DISCLAIMS ALL WARRANTIES, EXPRESS OR IMPLIED, INCLUDING BUT NOT LIMITED TO ANY WARRANTY THAT THE USE OF THE INFORMATION HEREIN WILL NOT INFRINGE ANY RIGHTS OR ANY IMPLIED WARRANTIES OF MERCHANTABILITY OR FITNESS FOR A PARTICULAR PURPOSE.
The attention of users of this document is directed to the possibility that compliance with or adoption of XBRL International specifications may require use of an invention covered by patent rights. XBRL International shall not be responsible for identifying patents for which a license may be required by any XBRL International specification, or for conducting legal inquiries into the legal validity or scope of those patents that are brought to its attention. XBRL International specifications are prospective and advisory only. Prospective users are responsible for protecting themselves against liability for infringement of patents. XBRL International takes no position regarding the validity or scope of any intellectual property or other rights that might be claimed to pertain to the implementation or use of the technology described in this document or the extent to which any license under such rights might or might not be available; neither does it represent that it has made any effort to identify any such rights. Members of XBRL International agree to grant certain licenses under the XBRL International Intellectual Property Policy (https://www.xbrl.org/legal).
| Date | Author | Details |
|---|---|---|
| 6 February 2019 | Paul Warren | First published version |