Using LLMs to Analyse Narrative Disclosures | Overview of disclosure
Narratives in disclosures are just as important as numbers—but much harder to analyze. Numbers can be easily fed into a model for comparison or trend analysis. Text, however, is less straightforward. Regulatory disclosures, especially sustainability reports, often contain large volumes of narrative information: policies, strategies, risk explanations, and qualitative context.
Traditionally, text analytics has been used to track and extract meaning from such disclosures. Today, with Large Language Models (LLMs), we have more powerful tools to work with narrative data. LLMs can help sift through complex text, highlight key themes, and even compare narratives across companies or over time—tasks that would otherwise require hours of manual review.
XBRL plays a critical role here. By structuring information into logical, machine-readable sections, XBRL allows analysts to isolate the relevant part of a disclosure—say, the climate risk policy or human capital section—without needing to process the entire document. You can feed just that section into an LLM and let it assist you in exploring the narrative, spotting gaps, or benchmarking language.
In this blog series, we’ll look at a few simple prompt examples to show how structured narrative disclosures can be analysed effectively with LLMs. This is the first part in the series which looks at starting with a simple understanding of what narrative data is reported.
For this analysis in the series, I used iXBRL Ukrainian Annual Reports for 2022, available through filings.xbrl.org. The reports were extracted in xBRL-JSON format, combined using python and then uploaded into ChatGPT for exploration. (If you’d like to learn more about working with XBRL reports in JSON and experimenting with LLMs, see this blog or this webinar playback.) .
Overview across reports
The Ukrainian Annual Reports contain not just financial data but also audit-related metadata—such as the audit firm code, signing partner, and type of audit opinion. This metadata provides valuable context to understand the overall assurance landscape across companies.
With a simple prompt, I was able to explore auditor-related disclosures across 900+ reports, surfacing patterns and comparisons that would be very time-consuming to compile manually.
First, let’s start with a simple question: What types of audit opinions have been issued, and how many companies received a clean, qualified, or adverse opinion? This forms our starting point for understanding overall audit quality and identifying potential risk areas.
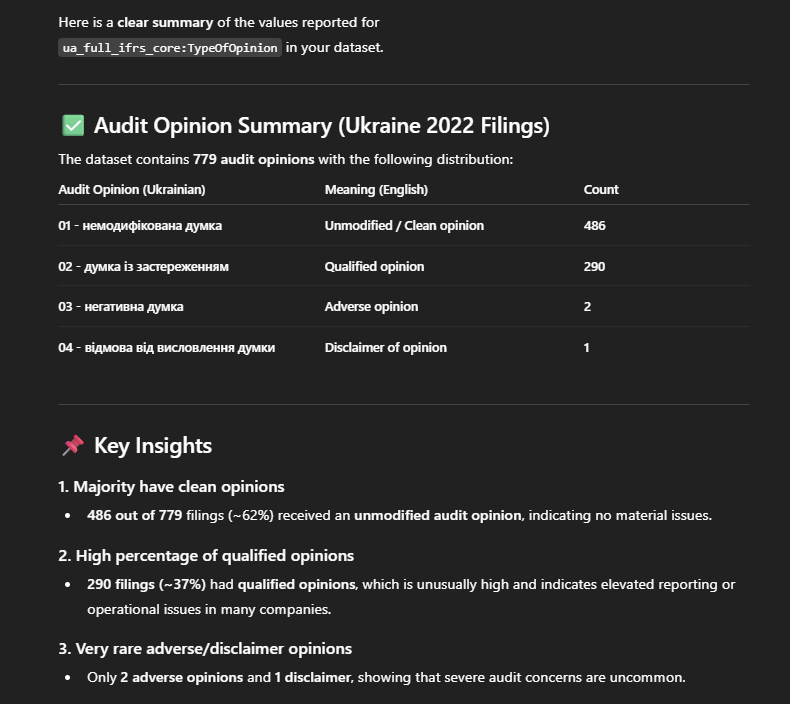
Here it indicates most companies received a clean audit opinion, while a notable share received qualified opinions reflecting some concerns. Adverse and disclaimer opinions were extremely rare, indicating only a few cases of severe audit issues. Now one can dive further into the reports that received qualified or adverse audit opinions. This initial query simply helps establish a high-level understanding of the landscape and demonstrates how easily we can extract meaningful insights when structured data is available. Even a basic prompt can reveal patterns, highlight outliers, and guide where deeper analysis is needed.
Next, let’s move to finding a frequency and Pareto analysis of the “NameOfTheAuditEntity”. It shows how often each audit firm appears across all entities in the dataset, allowing us to identify which firms dominate the audit landscape. The frequency distribution highlights the number of companies audited by each firm, revealing whether the market is concentrated among a few major players or more evenly spread. Applying the Pareto principle (80/20 rule) typically shows that a small number of audit firms account for a large share of total audits—meaning a handful of firms appear repeatedly across filings, making them the most influential and widely engaged auditors. This combined analysis helps quickly identify the top audit firms, understand their relative market share, and detect whether the audit ecosystem is highly concentrated or diversified.
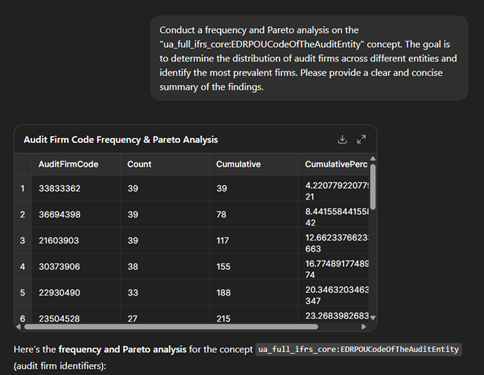
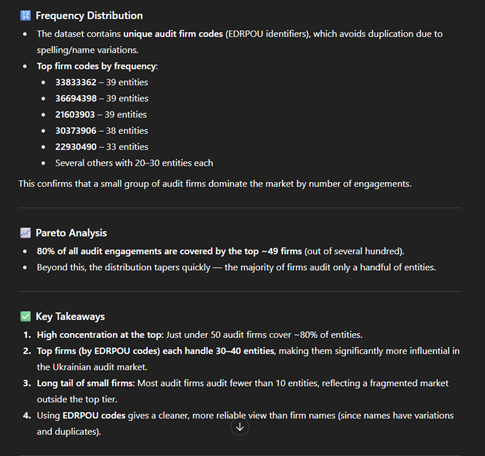
We observe a clear concentration of audit firms—a pattern that may be typical, but here it emerges effortlessly from the prompt-driven analysis. The key enabler is the structured tagging of audit firm codes (EDRPOU), which makes this kind of analysis straightforward and reliable. In contrast, trying to extract audit firm names from PDF reports would introduce inefficiencies and inconsistencies, making the results far less dependable.
This structured information is also crucial because it allows us to correlate specific disclosure patterns with particular audit firms. By linking EDRPOU codes to filing behaviors, we can identify whether certain firms consistently follow specific reporting templates, exhibit unique disclosure structures, or cluster around particular types of entities. Such insights are invaluable for regulators and analysts, enabling targeted quality reviews, detecting systemic reporting trends, and designing more effective supervisory interventions. Ultimately, such analysis supports a more transparent, data-driven regulatory environment where issues can be detected early, resources can be deployed strategically, and overall confidence in financial reporting is strengthened.
In the next blog in the series, we will look at different narrative sections to better understand the topics discussed and detect outliers or unusual patterns. By examining how disclosures are described across companies, we can spot anomalies — instances where a company reports something that deviates from the common structure or tone.