Topic Analysis and Anomaly Detection | Using LLMs to Analyse Narrative Disclosures
This is the second entry in the series “Using LLMs to Analyse Narrative Disclosures.” In the previous piece, we saw how a simple prompt was sufficient to uncover the pattern of audit firms across 900 reports. Because the exact fact — the audit firm code (EDRPOU) — was explicitly tagged, it became easy and reliable to pinpoint this information and generate a clear overview of the concentration pattern.
In this series, we shift focus to understanding risk disclosures more deeply — exploring what topics are addressed, how they are framed, and how these narratives vary across companies.
Topic Analysis
Topic analysis helps in understanding the overall trends in narrative disclosures. It is especially useful if you are new to the domain, have limited prior exposure, or need to present a high-level overview of what the disclosures contain. By applying topic modelling, we can identify the broad themes and clusters of discussion across reports. This gives us insight into what is commonly disclosed, the recurring trends, and the main focus areas highlighted by reporting entities.
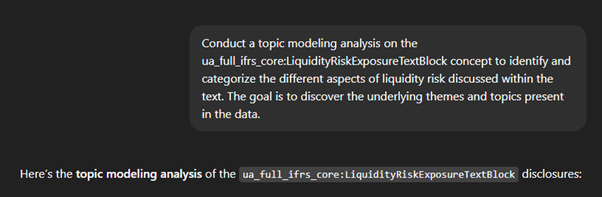
As an example, I asked ChatGPT to perform topic modelling on liquidity-related disclosures. The goal was to understand the different aspects companies focus on when discussing liquidity. This kind of targeted topic analysis helps break down a broad concept—like liquidity—into its component themes, such as cash flow management, credit facilities, debt maturity, and risk management practices.
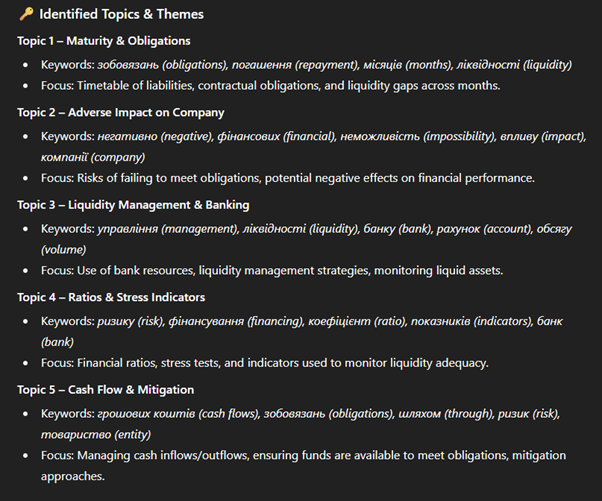
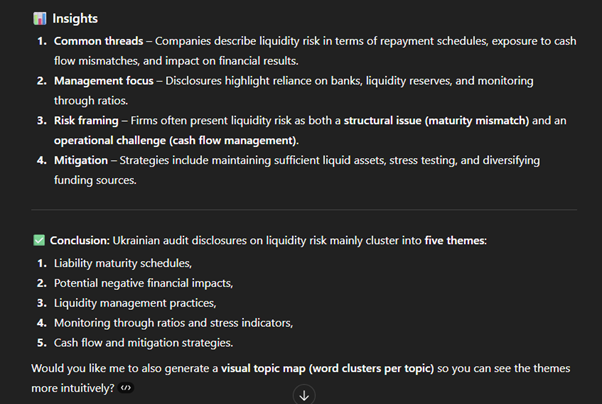
We observe clear disclosure patterns around liquidity risk—most companies frame it in terms of repayment schedules, reliance on banks, and strategies such as maintaining reserves or stress testing. What’s important here is how easily these themes emerged from a simple prompt, supported by ChatGPT’s ability to translate Ukrainian narratives into English. The structured tagging in XBRL meant I could target only the sections marked as ‘liquidity risk,’ avoiding noise and making the analysis both efficient and reliable. This demonstrates how LLMs, combined with structured data, can quickly provide a meaningful overview before deeper exploration.
LLMs can also suggest quick next questions. These are not definitive answers, but they often provide a useful direction for deeper exploration.
Anomaly Detection
After understanding the general disclosure patterns, the next step is to look for outliers—those disclosures that stand out from the rest. Identifying anomalies can be particularly useful for spotting unusual practices, potential risks, or companies that deviate from common reporting norms.
Traditionally, text analysis methods require significant data preparation. Analysts might cluster documents, identify words that are particularly distinctive to specific documents rather than common across all filings, or apply density-based algorithms to detect anomalies. While powerful, these approaches demand technical expertise and detailed configuration.
With LLMs, however, the process becomes much simpler. Instead of building complex pipelines, you can directly ask the model to highlight disclosures that appear unusual compared to the majority. This lowers the barrier for business analysts, enabling them to focus on interpreting results rather than setting up infrastructure. Importantly, the flagged anomalies can still be cross-checked against the underlying structured data, ensuring reliability and traceability.
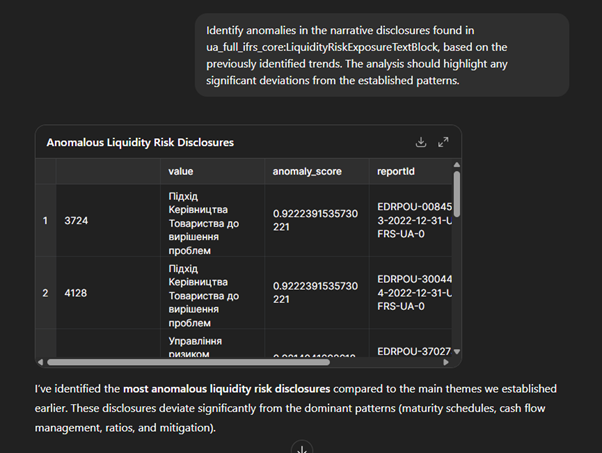
We notice a few companies provide narrative-heavy, qualitative, management-style disclosures with fewer metrics—omitting details such as repayment schedules, liquidity ratios, stress indicators, or cash flow forecasts. This difference could be of interest to investors, as such qualitative emphasis might influence how models are configured or how credit ratings are factored. The ‘next actions’ suggested by the LLM also point toward interesting directions—for example, exploring whether these disclosure styles correlate with specific auditors or market segments.
With a simple follow-up prompt, you can even ask the model to identify which reports exhibit these patterns and review them directly.
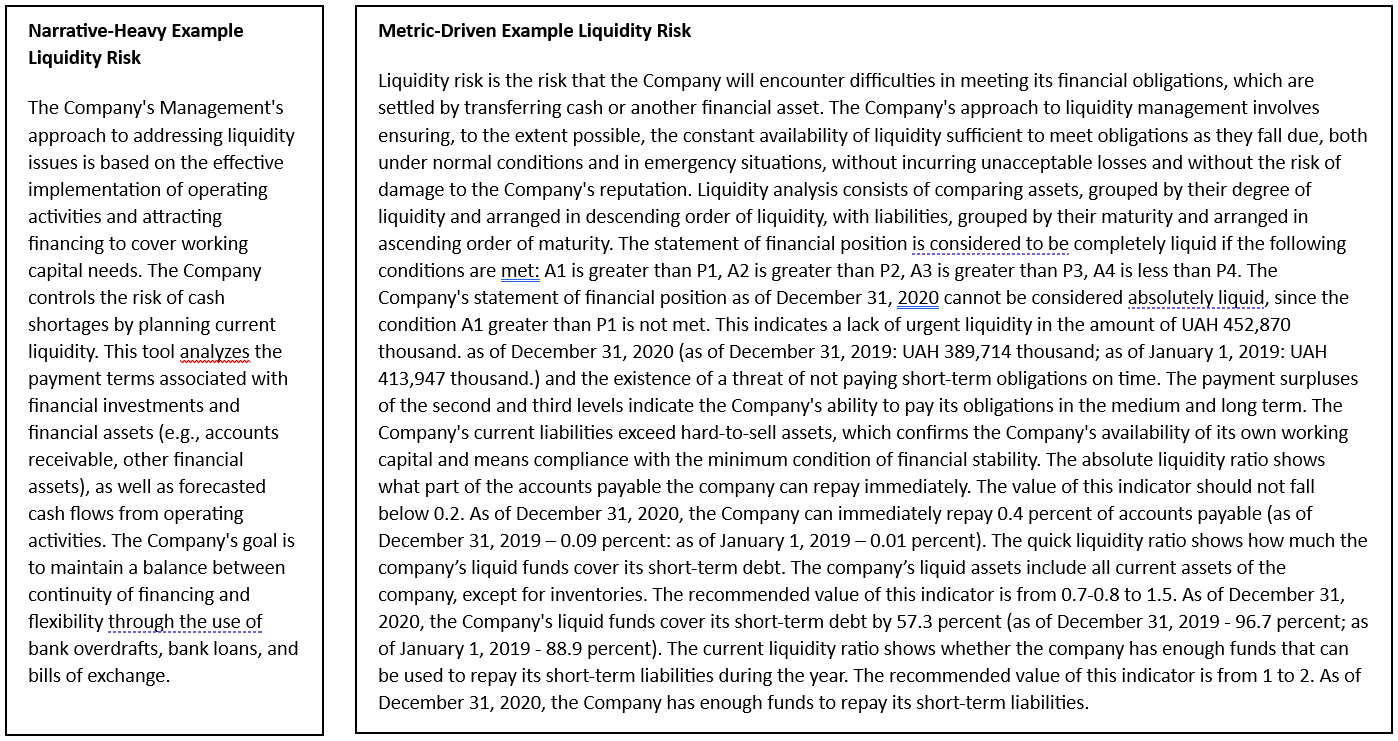
To illustrate, here’s a comparison between an anomalous liquidity disclosure and a standard disclosure. The contrast shows how anomalies often miss key specifics that are commonly included in typical reports.
Narrative-Heavy Example Liquidity Risk
- Source Report – Poltava Poultry Farm
- Excerpt:
“Підхід Керівництва Товариства до вирішення проблем ліквідності…” - Focuses on management’s approach to addressing liquidity risk.
- No specific figures or ratios provided.
Metric-Driven Example Liquidity Risk
- Source Report – Odessa Cognac Plant
- Excerpt:
“Ризик ліквідності полягає в тому, що у Компанії може виникнути нестача коштів для погашення зобов’язань… Станом на 31 грудня 2022 року короткострокові зобов’язання становили … грн, грошові кошти … грн, співвідношення ліквідних активів до поточних зобов’язань …%.” - Provides quantified obligations, cash balances, and liquidity ratios.
- Allows for comparability and risk assessment.
For clarity, I auto-translated the original Ukrainian text into English. This makes the differences more visible and easier to interpret.
In this second blog in the series, we saw how liquidity risk disclosures reveal clear patterns when structured XBRL tagging is combined with LLM-powered translation and summarisation. Equally insightful were the outliers, while most companies followed common themes, a few used narrative-heavy disclosures with fewer metrics — a difference that may signal distinct reporting behaviours or market positions.
Next in the series: we’ll extend this approach to sentiment analysis — examining how management teams frame their outlook, the tone they adopt, and how these narrative signals may correlate with risk appetite and market positioning.