
From Data to Insights: AI-Powered XBRL Analysis in Practice

This guest opinion piece is the second in a series from Björn Fastabend, bringing us a regulator’s perspective alongside a wealth of experience in digital reporting. Björn is head of the XBRL collection and processing unit at BaFin, Germany’s Federal Financial Supervisory Authority. He is also a member of XBRL International’s Board of Directors, and previously chaired our Best Practices Board.
The views and opinions expressed in this publication are those of the author. They do not purport to reflect the opinions or views of BaFin.
Examples were created with the help of Revathy Ramanan, XBRL International Guidance Manager.

From Structured Queries to Open Exploration
In my last article, I explored how AI and XBRL form a natural partnership for regulatory data analysis. Now, let’s examine how this partnership works in practice.
As we collect growing volumes of increasingly granular data, regulators today face a critical challenge: finding meaningful signals amid the noise. While Business Intelligence (BI) tools excel at answering specific, predefined questions, they require users to know exactly what they’re looking for. But how do we discover what we don’t yet know to ask?
This is where AI’s unique strengths come into play. AI enables open-ended exploration of XBRL data, allowing us to uncover patterns, anomalies, and relationships that might otherwise remain hidden. It complements the precision of BI tools, creating a powerful analytical workflow that enhances rather than replaces our existing processes.
Breaking New Ground with Open-Ended Analysis
BI tools shine when given specific parameters and metrics to analyze, in questions such as: “Compare the liquidity coverage ratios of all mid-sized credit institutions in the Northeast region against the industry average, highlighting any institutions falling below the regulatory threshold.” Such a request typically needs to be “translated” for the BI tool – whether through drag-and-drop interfaces, filters, or custom code – and, if the information is available, will produce an unambiguous answer.
AI systems, however, excel with open-ended inquiries that would be difficult to formulate as traditional database queries, such as:
- “In our supervised entities, are there any unexpected correlations between non-traditional risk factors that wouldn’t be apparent from standard financial ratios but might signal vulnerability to market stress?”
- “What patterns in this year’s reporting differ significantly from previous years across the sector?”
- “Which entities show unusual relationships between their operational metrics and financial outcomes compared to their peers?”
These questions don’t specify exactly what to look for – instead, they ask the AI to identify what might be significant or unusual within the data – and can be asked directly.
Here’s a simple example, where we provided ChatGPT with a single real XBRL report (in Europe’s ESEF format) and asked it for any unusual patterns. It immediately identifies several interesting areas for further analysis and provides an overall summary.
Incorporating AI exploration enables:
- Pattern detection without preconceptions: The AI can identify relationships across all data, without being limited to predefined metrics.
- Anomaly identification without defined rules: Rather than checking against predetermined thresholds, AI can dynamically determine what constitutes an anomaly in complex, multivariate contexts.
- Relationship discovery across diverse data points: The AI can identify connections between seemingly unrelated aspects of the data that might not be obvious to human analysts.
Perhaps most importantly, AI democratizes data access. The ability to interact with complex XBRL data using natural language makes sophisticated analysis accessible to supervisors without specialized technical expertise. This doesn’t eliminate the need for data scientists and BI analysts – rather, it allows them to focus their specialized skills on verifying and deepening the preliminary insights identified through AI exploration.
From Discovery to Investigation: A Practical Workflow
Let’s walk through a typical example of how this complementary analytical process works in practice.
A regulatory analyst has a suspicion around earnings management and is looking for potential anomalies in corporate expenses in P&L disclosures, but she lacks a specific hypothesis to test. With traditional tools, this vague concern might be difficult to pursue. Using an AI system with access to the XBRL database, she begins with a broad question:
“What unusual patterns exist in how companies reported the breakdown of above-the-line expenses this year compared to previous years?”
The AI examines the underlying XBRL data across numerous reports and all available metrics.
“Below is a summary of some of the unusual patterns observed in the financial data:
Key Observations
-
- Abrupt Spikes or Dips in Financial Figures
-
- Expenses vs. Revenue: Some reports show a sudden spike in expenses that isn’t matched by a corresponding increase in revenue. This kind of divergence can indicate one-off costs, extraordinary operational challenges, or even potential data entry errors.
- Profit Margins: There are instances where profit margins swing sharply, with periods of near-zero or even negative profits. This suggests either the revenue or cost figures in those periods are not following the usual trend.
-
- Anomalous Ratios and Consistency Issues
-
- Asset-to-Liability Relationships: In a few reports, the ratios between assets and liabilities seem inconsistent with the broader trend. Such anomalies may signal either a structural change in how financial reporting is done or inconsistencies that warrant further validation.
- Rounding or Estimation Patterns: Some values appear overly rounded or uniform, which might indicate that the data has been aggregated or estimated rather than precisely measured.”
The AI then suggests specific next steps for further investigation:
“Next Steps for Further Analysis
-
- Visualize the Data:
Create time series plots for key metrics (revenue, expenses, profit margins, etc.) to visually identify the timing and magnitude of these anomalies.
-
- Statistical Outlier Detection:
Use statistical methods (e.g., standard deviation analysis, IQR-based filtering) to formally identify outlier values. This can help determine if the unusual patterns are statistically significant.
-
- Contextual Correlation:
Investigate if the dates corresponding to the unusual financial figures match known external events that might explain some of the variability.
-
- Data Verification:
Cross-reference these figures with other reliable financial sources or reports to determine whether these patterns are unique to this dataset or reflect a broader trend.”
To refine these initial findings, the analyst asks a follow-up question:
“Which companies show this pattern most clearly and has this pattern also occurred in previous years?”
The AI now identifies five specific companies exhibiting this pattern consistently over multiple reporting periods. Armed with concrete information, the analyst turns to the BI system to verify and deepen this analysis.
Using established dashboards, she creates detailed year-over-year expense classifications comparing the identified companies against peer-group benchmarks. This reveals that these companies have systematically reclassified certain investments in ways that affect key performance indicators used by investors. Based on this information – documented through the BI system to ensure it can withstand legal scrutiny – the regulator issues appropriate warnings to the companies involved.
This example illustrates the seamless interplay between AI-powered exploration and BI-driven verification. The initial pattern would have been difficult to detect without knowing exactly what to look for, but the AI effectively narrowed the scope of investigation, allowing the analyst to use BI tools for targeted, definitive analysis.
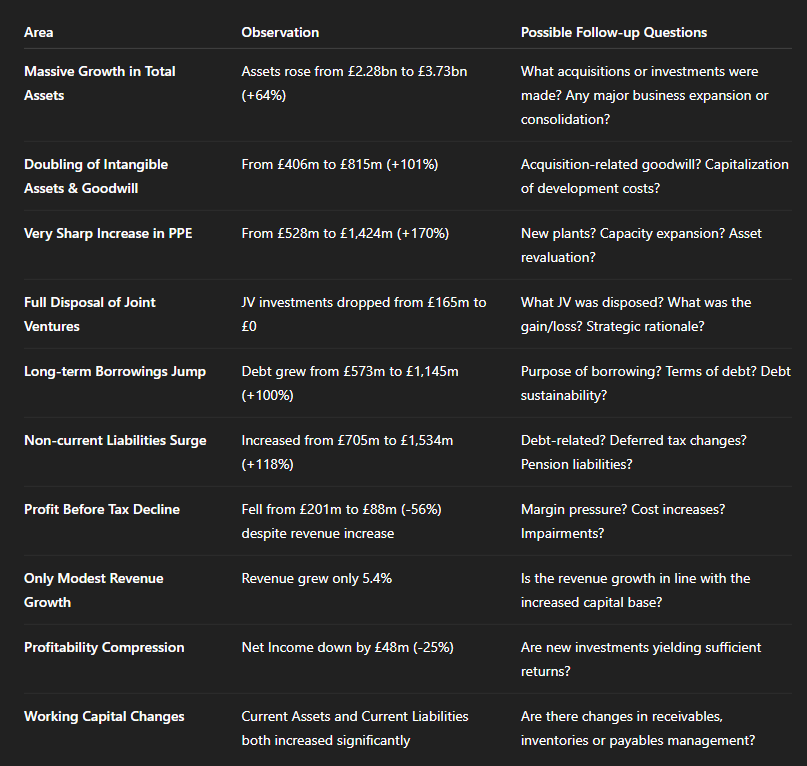
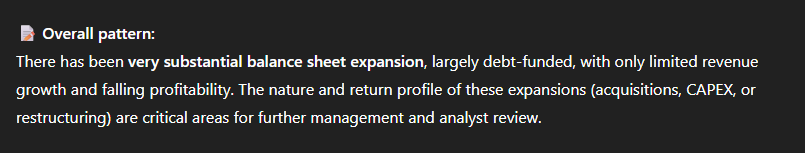
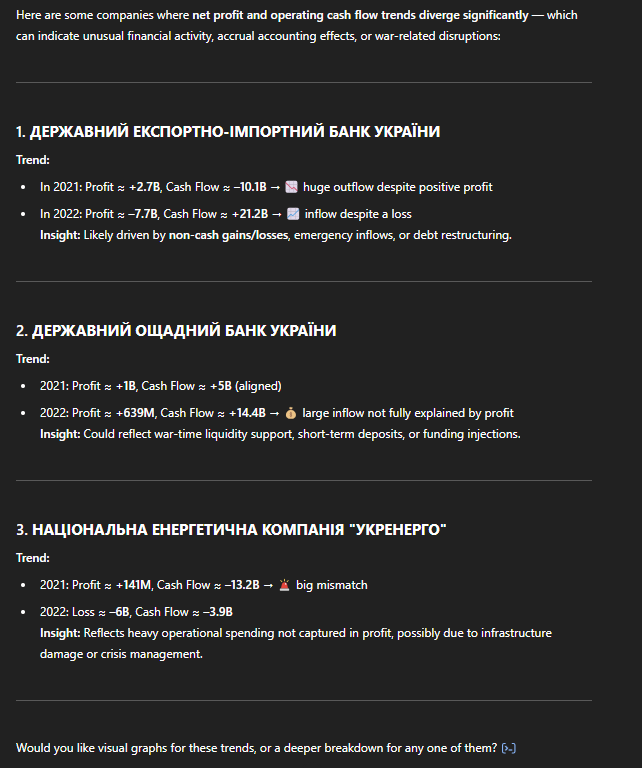
Here are results from a similar process where ChatGPT was provided with 100 annual reports from Ukraine. It identified unusual patterns across the reports, with steps for further investigation, and subsequently identified three specific companies of interest. In this case, we know that war-related disruption is the likely cause of abnormalities, and we want to understand its various impacts more deeply.
Building an Effective Workflow in Regulatory Settings
By leveraging AI for initial exploration and following up with BI, regulators can maintain the rigorous standards required for regulatory decision-making while benefiting from AI’s ability to identify patterns in vast datasets. In combining the two, it is key that both AI and BI tools access the same underlying XBRL data.
This workflow offers several key advantages:
- Efficiency in data exploration: AI rapidly identifies potential areas of interest, reducing the time analysts spend searching for significant patterns.
- Accessibility for non-technical users: Natural-language interaction removes barriers to data analysis for supervisors without specialized technical training.
- Complementary strengths: The exploratory power of AI, the precision of BI tools, and XBRL’s structured foundation create a three-way synergy that delivers insights greater than any single approach could achieve.
- Scalability for growing data volumes: As regulatory reporting grows in scope and granularity, this approach scales effectively to handle increasingly complex data.
The approach described here represents a practical, balanced way for regulators to significantly enhance our analytic capabilities while maintaining necessary rigor. It integrates seamlessly with existing processes, requiring minimal adjustment to current workflows.
As we’ll explore in the next article in this series, implementation does present certain challenges that must be addressed thoughtfully. These include ensuring appropriate verification of AI-generated insights, maintaining clear audit trails, and establishing governance frameworks that define the boundaries of AI’s role in regulatory analysis.
By proactively addressing these considerations, regulators can harness the powerful combination of XBRL’s semantic richness and AI’s analytical capabilities to significantly enhance their supervisory effectiveness in an increasingly complex financial landscape.