Comparison Across Years | Using LLMs to Analyse Narrative Disclosures
This is the fourth entry in the blog series “Using LLMs to Analyse Narrative Disclosures.”
So far, we’ve seen how structured XBRL tagged data combined with LLMs enables quick and meaningful analysis — from identifying disclosure patterns and anomalies to exploring sentiment and tone in management narratives.
In this part, we’ll take the analysis a step further by comparing consecutive reports from the same company. By looking at what text has changed over time, we can identify shifts in focus, or strategy, giving a clear picture of how disclosures evolve year by year.
Year on Year Comparison
I compared a company’s reports across two consecutive years—2023 and 2022—by asking ChatGPT to analyse all narrative disclosures and highlight any changes.
This approach makes it easy to spot shifts in tone, emphasis, or policy updates year over year. For example, disclosures such as accounting policies are often repeated with little change, providing a quick check to confirm consistency. At the same time, any variations in sections such as risk management, strategy, or sustainability become immediately visible, saving hours of manual side-by-side reading.
The report uses the IFRS taxonomy, where text blocks concept ends with the word “Explanatory.” I used this naming pattern to query and compare all such disclosures across the two periods.
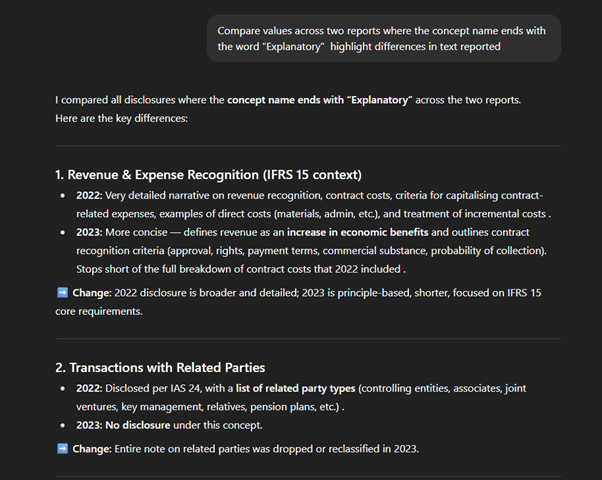
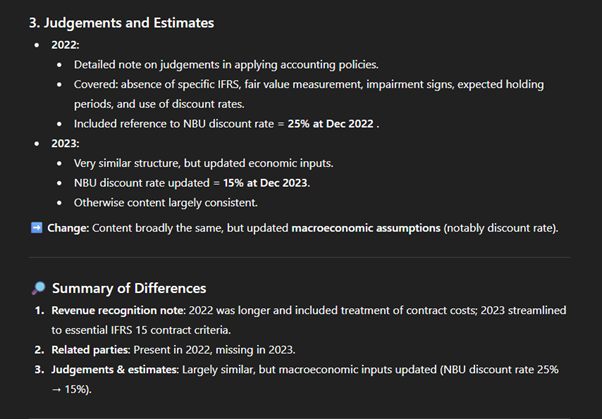
This comparison proves very useful as a quick summary of major changes, helping analysts decide where to dive deeper. It highlights three key year-on-year differences: revenue recognition expanded in 2022 but streamlined in 2023; the accounting policy for transactions with related parties was present in 2022 but missing in 2023; and judgements & estimates were updated for macroeconomic inputs (NBU discount rate 25% → 15%). Such targeted comparisons save time and direct attention to the sections most likely to impact analysis and interpretation.
Summary
Structured data and LLMs together unlock new possibilities for analysing narrative disclosures. XBRL ensures that each section of a report is tagged and machine-readable, so analysts can target exactly the text they need without sifting through entire documents. This structure eliminates noise and inefficiency, providing a clean foundation for analysis.
Once isolated, LLMs make it easy to run free-form analysis—whether it’s concentration checks on audit firms, topic modelling of liquidity risk, anomaly detection, sentiment classification, or year-on-year comparisons. With just a few simple prompts, heavy narrative text can be summarised, compared, and interrogated.
Throughout this series, we saw practical examples of how these techniques work in action:
- Identifying audit firm concentration through tagged data.
- Extracting liquidity risk themes from narrative disclosures.
- Detecting outliers and tone differences through anomaly and sentiment analysis.
- Comparing reports over time to reveal how narratives evolve.
The combination of structured tagging and flexible LLM exploration provides a powerful first step in understanding disclosure patterns. It doesn’t replace deeper expert review, but it gives analysts, regulators, and investors a faster way to orient themselves, spot trends, and decide where to focus next.