
This document is a review draft. Readers are invited to submit comments to the Best Practices Board.
Table of Contents
- 1 Introduction
- 2 What are XBRL Reporting Templates?
- 3 Use cases for XBRL Reporting Templates
- 4 Scope
- 5 How to define an XBRL reporting template
- 5.1 Simple Fixed Layout (breakdown, axis, rule nodes)
- 5.2 Nested Columns and Indented Rows (abstract rule nodes, rule node hierarchy)
- 5.3 Multiple headers (Labels)
- 5.4 Open layout - variable number of rows (aspect node: typed dimension)
- 5.5 Open layout - variable number of columns, ordering hierarchy (aspect node, parent-child order)
- 5.6 Repeating a table (the "z-axis")
- 5.7 Avoiding redundancy in table definition (aspect inheritance)
- 5.8 Simple multi-period table (parameters and dynamic aspect definition)
- 5.9 Multi-period reporting within a single column (rule sets, tags, and tag selectors)
- 5.10 Multi-currency reporting within a single column (unit aspect, rule set, tag, tag selector)
- 5.11 Repeating tables dynamically (dimension filter on z-axis)
- 5.12 Combining Open and Fixed Rows (combining aspect node and rule node)
- 5.13 Reusing taxonomy relationship (concept and dimension relationship node)
- 5.14 Combining taxonomy relationships re-use with multi-period reporting (ruleset and tag selector with concept relationship node)
- 5.15 Repetitive Hierarchy (multiple breakdowns with rule nodes)
- 5.16 Multiple open aspects on rows (multiple breakdowns with aspect nodes)
- 5.17 Open rows with intermittent totals (breakdown with rule node and aspect)
- 5.18 Simple, single column templates
- 5.19 Optional taxonomy-defined dimension(s) for open reporting scenarios ("Include Unreported Value" attribute)
- 5.20 Restricting facts in Table Rendering (Table Filters)
- 6 Appendix A Table Linkbase examples
1 Introduction
XBRL reporting templates are a standardised mechanism for defining a view of a taxonomy or report used for presentation or data entry purposes. At a technical level, XBRL reporting templates are created using the XBRL Table Linkbase specification1. This tutorial aims to explain the features available in this specification. This guidance is primarily aimed at taxonomy authors and architects seeking to recreate or represent the original layout of reporting templates in the XBRL standard.
2 What are XBRL Reporting Templates?
Many reporting systems use tabular reporting templates (or forms) to define the data that is to be collected.
XBRL’s Table Linkbase specification provides a framework for defining XBRL reporting templates in an XBRL taxonomy. These templates provide a human-readable tabular layout of XBRL data and can be used for both data entry (to create XBRL reports), and the presentation of reports.
XBRL reporting templates are independent of the underlying data modelling in the taxonomy. This allows the creation of templates that will be familiar and intuitive to end users, whilst maintaining a clean and consistent data model in the taxonomy.
3 Use cases for XBRL Reporting Templates
Table Linkbase allows the creation of XBRL reporting templates that facilitate:
- Simple input of reported values when generating XBRL reports
- Rendering of the reported XBRL data for business users
XBRL reporting templates can be used to represent simple reporting tables with a fixed number of rows and columns as well complex tables with features such as nested layouts, unlimited rows or columns, and multiple sheets.
XBRL reporting templates are primarily used in closed reporting environments where the data collectors prescribe a tabular view for the data that is to be reported. Such fixed template reporting is commonly found in risk and supervisory reporting to a financial regulator.
A separate Table Linkbase overview guidance document is available which explains the use cases for XBRL reporting templates and the features offered by the Table Linkbase specification. The overview guidance is helpful for audiences seeking a basic understanding of the specification. This tutorial is intended to provide a more detailed demonstration of how the features of the specification can be used to meet common business requirements.
4 Scope
This document explains how different types of XBRL reporting template can be defined. Reporting templates can have different characteristics, such as a fixed number of rows and columns, hierarchies in row and column headers, the ability to add rows, reporting for multiple periods or reusing existing taxonomy relationships.
This tutorial does not attempt to address all possible features of the Table Linkbase 1.0 specification but covers those required to address the most common table designs found in XBRL projects, as well as demonstrating some less used features.
5 How to define an XBRL reporting template
Creation of an XBRL reporting template requires software that supports the relevant XBRL specifications.
Each example in this tutorial is explained with a table layout to demonstrate visually what can be achieved with XBRL reporting templates, and uses a simplified tabular representation to explain the components, attributes and aspects2 used in the definition of an XBRL reporting template. The details of how these components are created will depend on the software being used.
There are a few basic constructs involved in the creation of an XBRL reporting template:
- A "Table ID" is an identifier for an XBRL reporting template.
- A "Table Breakdown" is a construct that is used to build tables with a predefined layout (i.e., rows, columns, and sheets). It identifies the axis where the structure needs to be displayed. A breakdown can have up to three types of axes: x, y and z
- An "x" axis table breakdown provides horizontal structure and will be displayed as columns in the table,
- Likewise, a "y" axis table breakdown provides vertical structure and will be displayed as rows in the table.
- It is also possible to define a "z" axis breakdown. A "z" axis breakdown would mean the repeating the entire table for different scenarios. Examples: Figure 7 and Figure 12 explain the z-axis feature.
5.1 Simple Fixed Layout (breakdown, axis, rule nodes)
Let’s take an example of a simple layout of a Geographical Segment Reporting disclosure, as shown in Figure 1
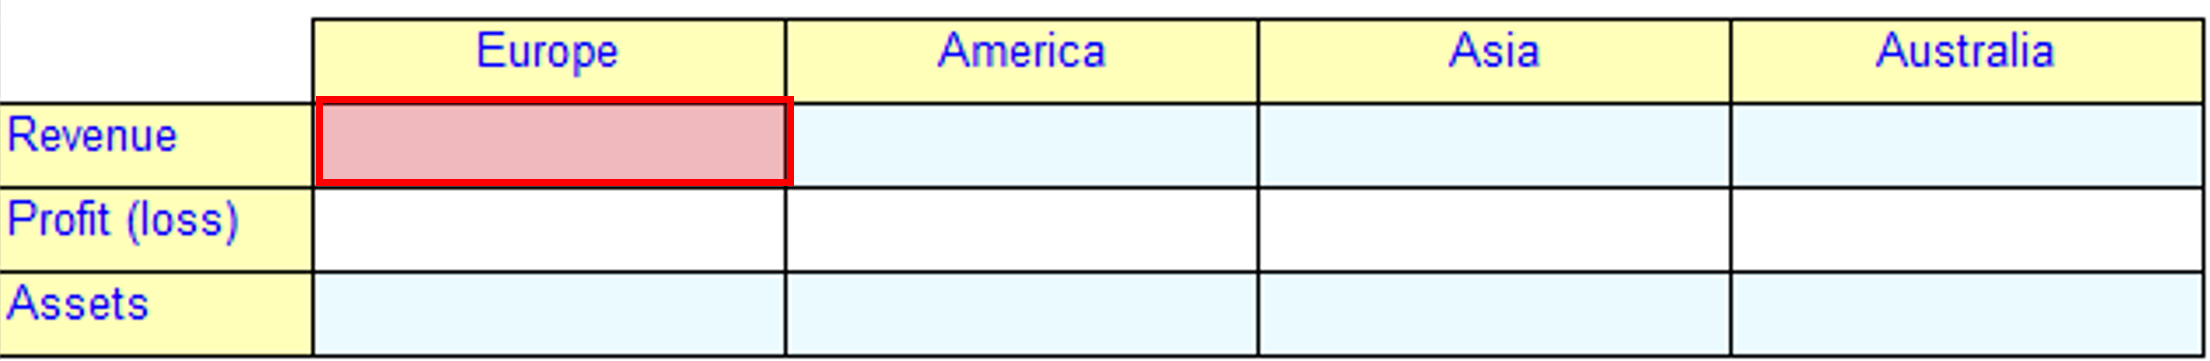 Figure 1: Geographical Segment Reporting
Table definition for Figure 1:
|
Components |
Properties |
Aspects |
|
Table |
tab01 |
|
|
Breakdown |
Axis = X |
|
|
Rule Node |
|
Explicit Dimension (OperatingSegmentDim = EuropeMember) |
|
Rule Node |
|
Explicit Dimension (OperatingSegmentDim = AmericaMember) |
|
Rule Node |
|
Explicit Dimension (OperatingSegmentDim = AsiaMember) |
|
Rule Node |
|
Explicit Dimension (OperatingSegmentDim = AustraliaMember) |
|
Breakdown |
Axis = Y |
|
|
Rule Node |
|
Concept (RevenuesFromSales) |
|
Rule Node |
|
Concept (ProfitLoss) |
|
Rule Node |
|
Concept (Assets) |
The first step in a table definition is to specify an ID for the table, which here is given as tab01 (highlighted in red).
Let’s start building columns for the table by defining an "x-axis breakdown" (highlighted in blue). The x-axis breakdown acts as a placeholder for columns.
In Figure 1, there are four fixed columns, which are specified by defining four "rule nodes" under the x-axis breakdown.
For each rule node, the common XBRL aspects applicable to the column are specified. Let’s use the first rule node (highlighted in yellow) representing the Europe column as an example. The rule node specifies OperatingSegmentDim3 as an explicit taxonomy-defined dimension and EuropeMember as its domain member. This specifies that all cells in the first column will carry this dimension value. Likewise, the taxonomy defined dimension values for other rule nodes along the x-axis breakdown are specified providing dimension values to each corresponding column.
As for columns, row construction begins with defining a breakdown for the relevant axis, in this case, the "y-axis breakdown". The y-axis breakdown acts as a placeholder for the rows. In Figure 1 there are three fixed rows, which are specified by defining three rule nodes.
Common aspects applicable across the row are defined at the rule node level. The first rule node representing the Revenue row specifies the concept as Revenue. This means that all cells across the first row will carry Revenue as their concept.
The aspects applicable to a cell are the union of aspects inherited from row and column rule nodes. For Figure 1 the highlighted cell, which represents Revenue for Europe, inherits the concept from its row rule node and taxonomy-defined dimension value from the column rule node. Let’s refer to this cell as A1.
When rendering an XBRL report using the XBRL reporting template, the facts that satisfy the aspect constraints of the cell are chosen to be displayed in that cell. For Figure 1 only fact(s) with concept Revenue and taxonomy-defined dimension OperatingSegmentDim with member EuropeMember will be displayed in cell A1. It should be noted that there could be multiple facts that satisfy the required constraints (for example, if there are facts reported for multiple periods). This should be generally be avoided by further constraining with other aspects (period, units, entity) to ensure only one fact is displayed in the cell. This is discussed in later examples.
When creating an XBRL report using the XBRL reporting template, the value entered in the cell will be reported with the inherited aspects of the cell and the software applications will enable preparers to specify any missing but required aspects such as period, entity and unit in this case.
By default, software will use the standard labels for the concepts and dimension members in the table, as shown below. In example Figure 4, we will see how these labels can be customised to match the more concise column labels used in Figure 1.
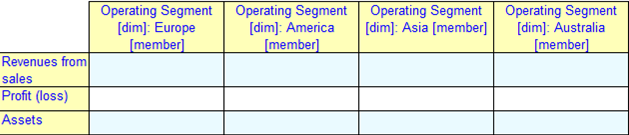 Figure 2
In this example we learnt:
- The table definition provides two primary functions:
- Defining the layout of the XBRL reporting template; and
- Defining aspects for the rows and columns.
5.2 Nested Columns and Indented Rows (abstract rule nodes, rule node hierarchy)
Reporting templates often have a complex layout involving nested columns and indented rows. A variation of the previous Segment Reporting example is shown in Figure 3. As before, the continents are modelled as domain members and the disclosure items are defined as concepts.
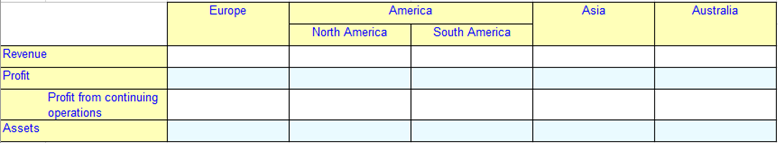 Figure 3: Geographical Segment Reporting
Table definition for Figure 3:
|
Components |
Properties |
Aspects |
|
Table |
tab01 |
|
|
Breakdown |
Axis = X |
|
|
Rule Node |
|
Explicit Dimension (OperatingSegmentDim = EuropeMember) |
|
Rule Node |
Abstract |
|
|
Rule Node |
|
Explicit Dimension (OperatingSegmentDim = NorthAmericaMember) |
|
Rule Node |
|
Explicit Dimension (OperatingSegmentDim = SouthAmericaMember) |
|
Rule Node |
|
Explicit Dimension (OperatingSegmentDim = AsiaMember) |
|
Rule Node |
|
Explicit Dimension (OperatingSegmentDim = AustraliaMember) |
|
Breakdown |
Axis = Y |
|
|
Rule Node |
|
Concept (RevenuesFromSales) |
|
Rule Node |
|
Concept (ProfitLoss) |
|
Rule Node |
|
Concept (ProfitFromContinuingOperations) |
|
Rule Node |
|
Concept (Assets) |
In Figure 3 we observe that the column for America is further split into North and South. On the row side, the disclosure item Profit from continuing operations is indented under the item Profit.
On the x-axis breakdown the columns North and South are created by defining additional rule nodes as "children" of the America rule node. This hierarchical relationship specifies that that the "child rule node" will be nested under the parent rule node in the layout. As the table does not permit a value for America as a whole to be reported, we add the "abstract" property to the America rule node (highlighted). An abstract rule node specifies that a separate column or row will not be rendered in the layout, but it will serve only as placeholder for columns or rows to be nested under it.
On the y-axis breakdown (the row layout), an additional rule node representing the Profit from continuing operations is defined as a "child" rule node of the rule node for ProfitLoss (highlighted). In this case, the table does allow a value to be reported for the parent item, so the abstract property is not set, and a separate row for Profit is included in the layout.
In this example we learnt:
- It is possible to recreate the nesting and indentation of rows and columns by using:
- A hierarchical arrangements of rule nodes within breakdowns; and
- The abstract property that can be set on rule nodes to provide additional headers for columns and rows.
5.3 Multiple headers (Labels)
One of the features of XBRL reporting templates is providing separation between the definition and presentation of data. For example, disclosure templates may have labels for columns and rows that do not match the underlying taxonomy element labels. The table definition allows taxonomy authors to specify alternative labels for rows and columns for use in the table.
Figure 4 shows an extension of the previous example. Structurally, the table definition is the same as in Figure 3.
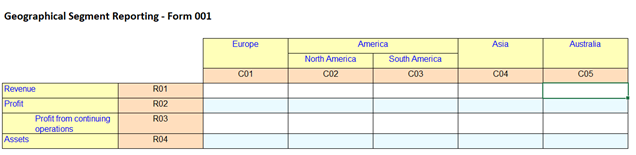 Figure 4: Geographical Segment Reporting
Table definition for Figure 4:
|
Components |
Properties |
Aspects |
Labels |
|
Table |
tab01 |
|
Standard en (Geographical Segment Reporting); Terse en (Form001) |
|
Breakdown |
Axis = X |
|
|
|
Rule Node |
|
Explicit Dimension (OperatingSegmentDim = EuropeMember) |
Standard en (Europe); rc-code en (C01) |
|
Rule Node |
Abstract |
|
Standard en (America) |
|
Rule Node |
|
Explicit Dimension (OperatingSegmentDim = NorthAmericaMember) |
Standard en (North America); rc-code en (C02) |
|
Rule Node |
|
Explicit Dimension (OperatingSegmentDim = SouthAmericaMember) |
Standard en (South America); rc-code en (C03) |
|
Rule Node |
|
Explicit Dimension (OperatingSegmentDim = AsiaMember) |
Standard en (Asia); rc-code en (C04) |
|
Rule Node |
|
Explicit Dimension (OperatingSegmentDim = AustraliaMember) |
Standard en (Australia); rc-code en (C05) |
|
Breakdown |
Axis = Y |
|
|
|
Rule Node |
|
Concept (RevenuesFromSales) |
Standard en (Revenue); rc-code en (R01) |
|
Rule Node |
|
Concept (ProfitLoss) |
Standard en (Profit); rc-code en (R02) |
|
Rule Node |
|
Concept (ProfitFromContinuingOperations) |
Standard en (Profit from continuing operations); rc-code en (R03) |
|
Rule Node |
|
Concept (Assets) |
Standard en (Assets); rc-code en (R04) |
A table title describing the contents of the table is defined as a label attached to the table. Here the title Geographical Segment Reporting is defined as a label for the table (highlighted in the Label column above).
The standard label role is used for the "table label", with a language code en indicating "English". Usually, only one label role is used to define the table title, but taxonomy authors can use other label roles (types) to create additional labels. For example a "terse label" may be used to provide an abbreviated table reference, such as Form 001.
The first column is labelled Europe. In the table definition this is specified on the first rule node on x-axis using the standard label role (highlighted). Similarly, for other rows and columns the descriptive heading is defined as a standard label. In some tables, it is useful to assign codes to identify rows and columns within a table so that cells can be concisely and unambiguously identified in in validation rules, error messages or documentation. In this example, each row and column is identified by a code. For example, R01 for the first row and C05 for the last column.
These codes can be defined in an XBRL reporting template as additional labels. In this example a custom label role, "rc-code", is used to define the code. For the first column (first rule node on the x-axis) C01 is defined using label role "rc-code". The "rc-code" (row – column) label role is used in taxonomies of some European projects such as those used for CRD IV and Solvency II reporting.
As for any XBRL taxonomy component, labels in an XBRL reporting template can be defined in multiple languages, allowing the template to be presented in different languages.
Where there are multiple labels for a single table or a rule node, the choice of which labels will be shown will depend on the software being used. It should be noted here that labels defined in XBRL reporting templates are attached to the table or the rule node and not the underlying concepts or dimension members.
In this example we learnt:
- Taxonomy authors can assign different types of labels for use as table, row and column headings.
5.4 Open layout - variable number of rows (aspect node: typed dimension)
The examples above have demonstrated the creation of XBRL reporting templates with a fixed layout.
Now we will look at a table in which the number of rows needs to vary in order to accommodate the reported data. We refer to this as a table with an open layout.
Figure 5 represents a disclosure of investments in a portfolio. Preparers are required to report all investments in the portfolio, including additional rows as required. Investments are identified by their ISIN, which is modelled as a typed dimension, allowing preparers to report any number of investments. The disclosure details of the investments are defined as concepts in the taxonomy.
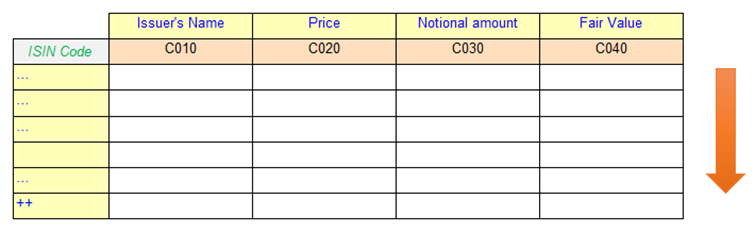 Figure 5: Portfolio disclosure
Table definition for Figure 5
|
Components |
Properties |
Aspects |
Labels |
|
Table |
tab04 |
|
Standard en (Portfolio disclosure); rcCode en (T04) |
|
Breakdown |
Axis = X |
|
|
|
Rule Node |
|
Concept (IssuerName) |
Standard en (Issuer's Name); rcCode en (C010) |
|
Rule Node |
|
Concept (MarketPrice) |
Standard en (Price); rcCode en (C020) |
|
Rule Node |
|
Concept (NominalAmount) |
Standard en (Nominal amount); rcCode en (C030) |
|
Rule Node |
|
Concept (FinancialAssetsAtFairValueThroughProfitOrLoss) |
Standard en (Fair Value); rcCode en (C030) |
|
Breakdown |
Axis = Y |
Explicit Dimension (OperatingSegmentDim = AsiaMember) |
Standard en (ISIN Code) |
|
Aspect Node |
|
Typed Dimension (InstrumentTDim) |
The previous examples have used rule nodes to define individual columns and rows. In this example we will use a different type of node, known as an "aspect node", to define the rows in the table.
On the y-axis the aspect node (highlighted) specifies the typed dimension InstrumentTDim. This means that:
- All facts in a row will share a common value of the InstrumentTDim dimension. This provides the ISIN identifier for the investment.
- The value of this dimension is used as the heading for the row.
- Preparers can report as many rows as required by adding new rows with different values of this dimension.
- Fact values will be rendered onto the table by matching two criteria: the concept specified for the column (x-axis) and the typed-dimension value for the row (y-axis)
When using an aspect node to create an open layout, the label attached to the breakdown that includes the aspect node is used to provide a heading for the column containing the aspect values (the first column).
In this example we learnt:
- Aspect node can be defined on the y-axis to enable addition of rows
- A breakdown can have its own label which is crucial if we are building open layout
5.5 Open layout - variable number of columns, ordering hierarchy (aspect node, parent-child order)
This example explains an open layout that allows multi-currency reporting. The template shown in Figure 6 allows preparers to report values of different types of derivatives, broken down by currency. Each currency has a separate column, and the preparer can include as many columns as required.
In this disclosure the different derivative products are defined as concepts and the currency is modelled using the unit aspect for the facts.
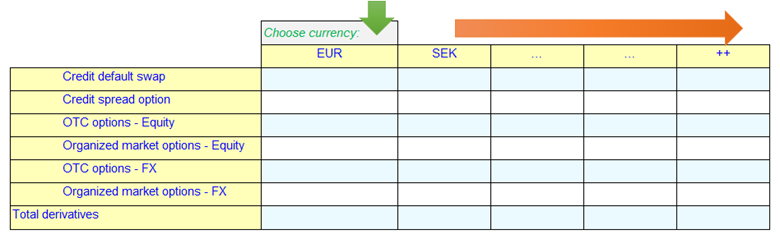 Figure 6: Fair value positions of derivatives by currency
Table definition for Figure 6:
|
Components |
Properties |
Aspects |
Labels |
|
Table |
tab05 |
|
|
|
Breakdown |
Axis = X |
|
Standard (Choose currency) |
|
Aspect Node |
|
Unit (unitAspect) |
|
|
Breakdown |
Axis = Y |
|
|
|
Rule Node |
Parent Child Order (children-first) |
Concept (FinancialDerivativeAssets) |
Standard (Total derivatives) |
|
Rule Node |
|
Concept (FinancialDerivativeAssetsCreditDefaultSwap) |
Standard (Credit default swap) |
|
Rule Node |
|
Concept (FinancialDerivativeAssetsCreditSpreadOption) |
Standard (Credit spread option) |
|
Rule Node |
|
Concept (FinancialDerivativeAssetsEquity_OTC_Options) |
Standard (OTC options - Equity) |
|
Rule Node |
|
Concept (FinancialDerivativeAssetsEquity_OrganizedMarket_Options) |
Standard (Organized market options - Equity) |
|
Rule Node |
|
Concept (FinancialDerivativeAssetsFX_OTC_Options) |
Standard (OTC options - FX) |
|
Rule Node |
|
Concept (FinancialDerivativeAssetsFX_OrganizedMarket_Options) |
Standard (Organized market options - FX) |
The "aspect node" on the x-axis breakdown (highlighted) allows additional columns to be added, creating an open layout. This is analogous to the example in Figure 5, but in this case the aspect node is used on the x-axis, and is a placeholder for the unit aspect. This means:
- Preparers can report as many columns as required – by adding new columns to the right
- Preparers are able to report a value for the unit aspect (such as USD, EUR or PLN) for each column.
A further detail to note in this example is that the bottom row of the table (Total derivatives) is the parent of the preceding, indented rows. This is a different arrangement to the examples seen in Figure 3 and Figure 4, where the parent item was shown before the indented child rows.
In order to achieve the layout shown in Figure 6, we can use the "Parent Child Order" attribute on the relevant rule node. The attribute can accept one of two values: "parent-first", which is the default, and specifies that the parent should appear before its children, or "children-first" specifying that the parent should follow the children, as we have in this example.
In this example we learnt:
- An aspect node can be defined on the x-axis to enable the addition of columns.
- To provide a unit aspect constraint, "unitAspect" can be used under an aspect node to provide multi-currency reporting scenario.
- The "Parent Child Order" attribute can be used to specify the order of display of the parent rule node with respect to its child rule nodes.
5.6 Repeating a table (the "z-axis")
In this example, we consider a scenario where preparers are required to report an Off-balance sheet exposures disclosure (Figure 7) that is repeated for multiple countries.
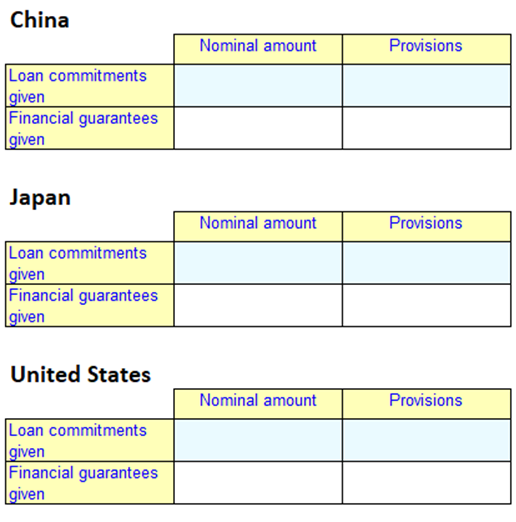 Figure 7: Off-balance sheet exposures by Country
 Whilst this data could be represented in a single table by repeating all rows or columns for each country, even this simple table would quickly become unwieldy.
XBRL reporting templates provide a third axis, known as the "z-axis" which can be used to define repeating tables.
In this example, Nominal amount and Provisions are columns modelled as concepts, which are broken down into Loan commitments given and Financial guarantees given as rows and modelled as dimension members. This table needs to be reported for 3 countries: China, Japan and United States (modelled as members on a second dimension).
Table definition for Figure 7:
|
Components |
Properties |
Aspects |
Labels |
|
Table |
tab06 |
||
|
Breakdown |
Axis = X |
||
|
Rule Node |
Concept (NominalAmount) |
Standard (Nominal amount |
|
|
Rule Node |
Concept (Provisions) |
Standard (Provisions) |
|
|
Breakdown |
Axis = Y |
||
|
Rule Node |
Explicit Dimension (TypeOfProvisionDim = LoanCommitmentsGivenMember) |
Standard (Loan commitments given) |
|
|
Rule Node |
Explicit Dimension (TypeOfProvisionDim = FinancialGuaranteesGivenMember) |
Standard (Financial guarantees given) |
|
|
Breakdown |
Axis = Z |
||
|
Rule Node |
Explicit Dimension (CountriesDim = ChinaMember) |
Standard (China) |
|
|
Rule Node |
Explicit Dimension (CountriesDim = JapanMember) |
Standard (Japan) |
|
|
Rule Node |
Explicit Dimension (CountriesDim = USMember) |
Standard (US) |
The repetition of the table is defined by introducing a breakdown for the "z-axis". In Figure 7 we can observe that three copies of same table were rendered. This is because there are three rule nodes on the z-axis (highlighted).
The aspect defined on the z-axis rule node is applicable to all cells of the table. In this example, all cells in the China table will inherit China Member as their Country dimension value.
Fact values will be rendered onto the table by matching three criteria: concept (x-axis), provision dimension(y-axis) and country dimension (z-axis). The headers for each copy of the table are the respective z-axis rule node labels.
It should be noted that in this example, the values on the z-axis are fixed. This means that three copies of the table will always be shown, regardless of whether they are needed or not by the end user. In a more realistic example, a preparer may be required to report this table for any country in which they have an exposure, and having the table repeated for every country in the world would be very cumbersome. A better approach to solving this case is described in Figure 12.
In this example we learnt:
- The z-axis can be used to repeat a table.
- The z-axis can be used when we need to apply a certain aspect (e.g. dimension) to the entire table
- The value from the z-axis is usually rendered as a header above the table
5.7 Avoiding redundancy in table definition (aspect inheritance)
Column or row headers in a table may be arranged in a hierarchy corresponding to multiple different aspects. In this example, we will see how the aspects applied to an individual cell are inherited through such a hierarchy, avoiding the need to specify all aspects on an individual row or column.
Let us consider a disclosure which has multiple levels of breakdown and define an XBRL reporting template.
Figure 8 is an extract of an Off-balance sheet exposures disclosure in which disclosure items are to be reported exposure type wise (Loans commitments given and Financial guarantees given) and counterparty wise (such as Credit Institutions, Non-financial corporations). The exposure type and counterparties are modelled as dimension and the disclosure items (Nominal Amount and Provision) are defined as concepts in the taxonomy.
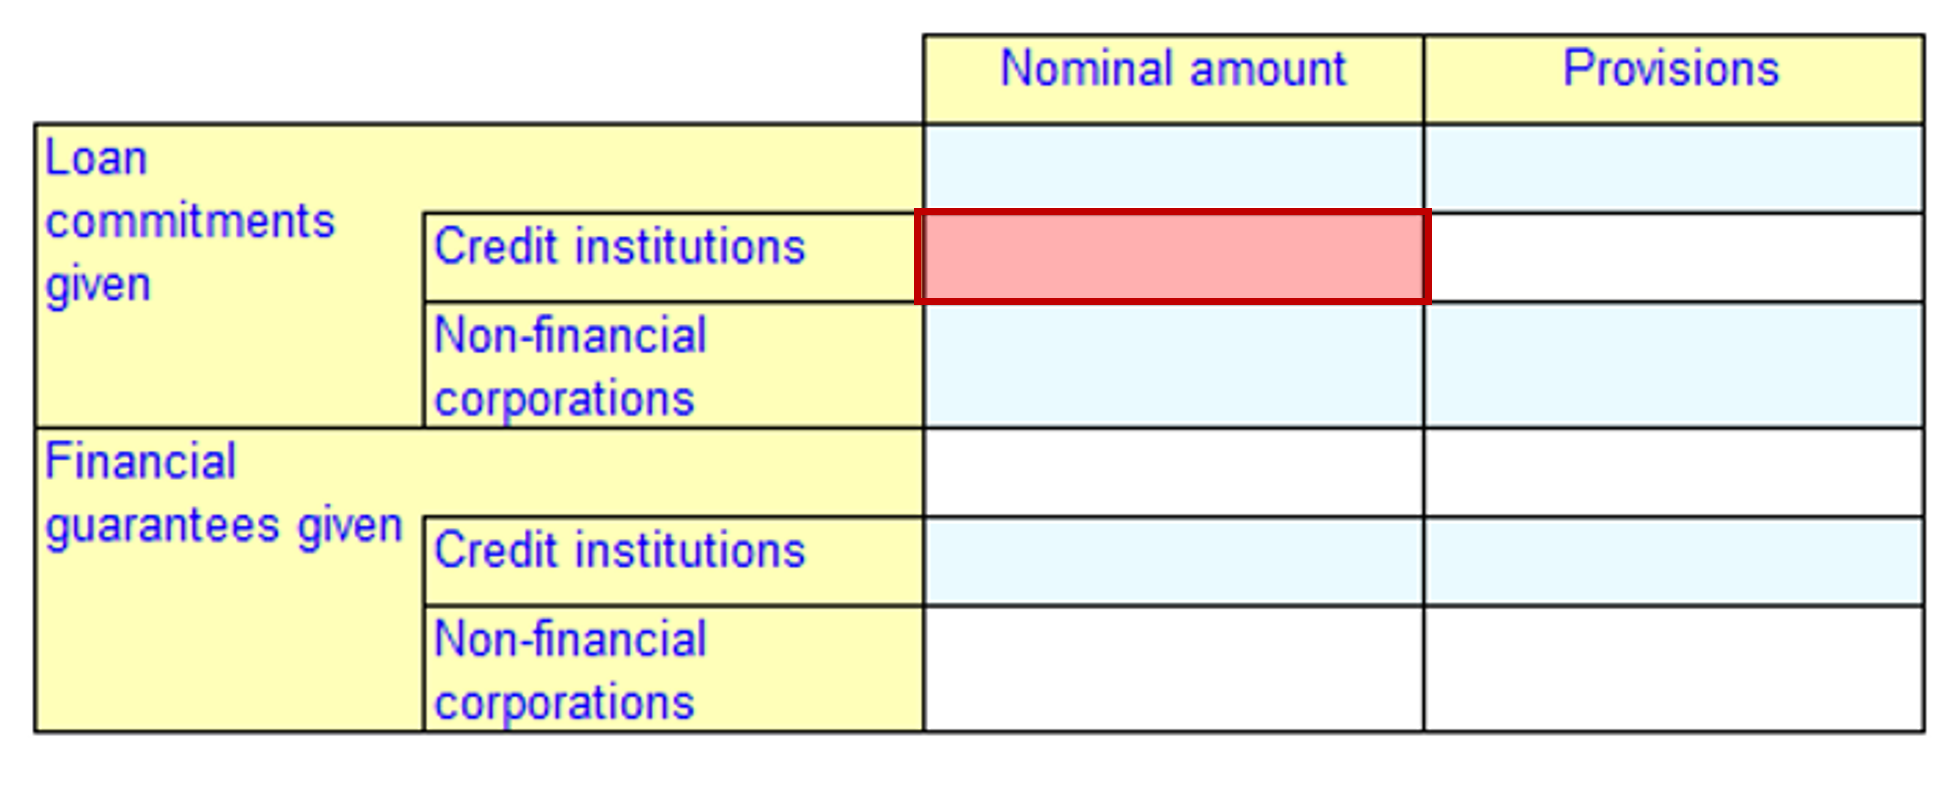 Figure 8: Off-balance sheet exposures
Table definition for Figure 8:
|
Components |
Properties |
Aspects |
Labels |
|
Table |
tab07 |
||
|
Breakdown |
Axis = X |
||
|
Rule Node |
Concept (NominalAmount) |
Standard (Nominal amount) |
|
|
Rule Node |
Concept (Provisions) |
Standard (Provisions) |
|
|
Breakdown |
Axis = Y |
||
|
Rule Node |
Explicit Dimension (TypeOfProvisionDim = LoanCommitmentsGivenMember) |
Standard (Loan commitments given) |
|
|
Rule Node |
Explicit Dimension (CounterpartyDim = CreditInstitutionsMember) |
Standard (Credit institutions) |
|
|
Rule Node |
Explicit Dimension (CounterpartyDim = NonFinancialCorporationsMember) |
Standard (Non-financial corporations) |
|
|
Rule Node |
Explicit Dimension (TypeOfProvisionDim = FinancialGuaranteesGivenMember) |
Standard (Financial guarantees given) |
|
|
Rule Node |
Explicit Dimension (CounterpartyDim = CreditInstitutionsMember) |
Standard (Credit institutions) |
|
|
Rule Node |
Explicit Dimension (CounterpartyDim = NonFinancialCorporationsMember) |
Standard (Non-financial corporations) |
The layout in Figure 8 requires a nested and indented row, which can be created using the rule node hierarchy. This is similar to the example in Figure 3, but in this case the levels in the hierarchy correspond to different dimensions, rather than to a hierarchy of members in a single dimension.
There are overall six rule nodes on the y-axis. The "parent rule nodes" (highlighted) define members on the Type of Provision dimension, and the child nodes define members on the Counterparty Dimension dimension.
Now, let us analyse the cell highlighted in Figure 8. This cell inherits the following aspects based on the rule nodes on the x and y axes:
- Concept - Nominal amount from the first column (first rule node on x-axis) defines concept.
- Dimension with member Credit institutions from the second row (second rule node on y-axis).
- In addition, the cell inherits the Loan commitments given member on the Type of Provision dimension from the parent rule node.
It should be noted that the inheritance mechanism works for all aspects, including, concepts, explicit and typed dimensions, period, unit, and entity. If a parent rule node contains the same aspect as its child rule node, the aspects defined in the child node take precedence over the parent rule node. This is demonstrated in the y-axis construct on Figure 3 where the parent and child rule node both had concept defined.
In the absence of aspect inheritance, the aspect definition would have to be repeated for every child node.
In this example we learnt:
- A child rule node inherits all aspects from its parent rule nodes (and all ancestors)
- This inheritance mechanism is applicable to all aspects.
- In the case of the same aspect being specified at multiple levels, the value defined in a child rule node takes priority over inherited aspects.
- Inheritance avoids repetition of aspect definition.
5.8 Simple multi-period table (parameters and dynamic aspect definition)
It is a common requirement in financial reporting for preparers to report facts for the current period and for one or more comparative periods. The dates required to define the period aspect changes for each reporting cycle and may also be different across entities.
Figure 9 shows an example of a table representing a simplified balance sheet containing figures for a current and prior period.
In this example, the reporting items on each row are modelled as concepts.
The facts are to be reported for a current and previous period. For example, the year ending on 2019-12-31 and 2018-12-31 respectively. However, we don’t want to hardcode specific dates into the table definition, as this would require updating the table definition for each reporting period, Instead, we would like to have a dynamic definition of the period that can set the values for the period aspect depending on user input.
In an XBRL reporting template, this dynamic definition can be addressed using "parameters". There are two types of parameters:
- table parameter – defined internally in a table and usable only by a specific table.
- global parameter – defined externally to any tables, reusable by any table in the report.
In this tutorial, we will only cover the more common global parameters.
To define a parameter, we need to provide values for four properties:
- name – the parameter name, to identify and refer to it.
- type – the XML Schema data type4 of the parameter value. For example, date, string or integer.
- required – Boolean value (true or false) to identify whether it is mandatory for a value for this parameter to be specified.
- default – a default value for a parameter, specified using XPath expression. A default value must be provided if "required" is false and should not be provided if "required" is true.
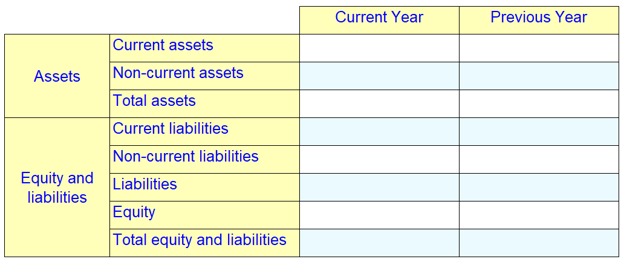 Figure 9: Balance Sheet
 Table definition for Figure 9:
|
Components |
Properties |
Aspects |
Labels |
|
Table |
tab08 |
|
|
|
Breakdown |
Axis = X |
|
|
|
Rule Node |
|
Period Instant ($refDate) |
Standard (Current Year) |
|
Rule Node |
|
Period Instant ($refDate - xs:yearMonthDuration('P1Y')) |
Standard (Previous Year) |
|
Breakdown |
Axis = Y |
|
|
|
Rule Node |
Abstract |
|
Standard (Assets) |
|
Rule Node |
|
Concept (CurrentAssets) |
Standard (Current assets) |
|
Rule Node |
|
Concept (NoncurrentAssets) |
Standard (Non-current assets) |
|
Rule Node |
|
Concept (Assets) |
Standard (Total assets) |
|
Rule Node |
Abstract |
|
Standard (Equity and liabilities) |
|
Rule Node |
|
Concept (CurrentLiabilities) |
Standard (Current liabilities) |
|
Rule Node |
|
Concept (NonCurrentLiabilities) |
Standard (Non-current liabilities) |
|
Rule Node |
|
Concept (Liabilities) |
Standard (Liabilities) |
|
Rule Node |
|
Concept (Equity) |
Standard (Equity) |
|
Rule Node |
|
Concept (EquityAndLiabilities) |
Standard (Total equity and liabilities) |
|
|
|
|
|
|
Parameter |
|
|
|
|
|
Name(refDate) |
|
|
|
|
type (date) |
|
|
|
|
required (FALSE) |
|
|
|
|
default(2019-12-31) |
|
|
Let us look at "parameter" definition (highlighted). "Parameter" is given a name refDate, its data type is specified as date, the required property is set as FALSE, which means it is not mandatory for the processing application to supply a value for this parameter. A default date value (2019-12-31) for the parameter is specified in the select property. This default value will be used by the XBRL application if a value for parameter is not supplied by the processing application.
We can now use this parameter to define values for the period aspect using rule nodes. In this example, there are two rule nodes for the period aspect, corresponding to the two columns in the table. The period aspect from the first rule node includes a direct reference to the parameter ($refDate). This means the period aspect value for the current year column will be the value of this parameter. In the second rule node (the previous year column) we use an XPath5 expression to get an automatic calculation of a comparative period date by subtracting a one year interval (P1Y)6 from the refDate parameter. For example, if the value of refDate is 2019-12-31, the period aspect for the previous period column will be calculated as 2018-12-31. (The assumption here is the previous period to be reported is exactly one year before the current period)
The mechanism by which values for parameters are provided will depend on the processing application in use.
In this example we learnt:
- In addition to specifying concepts and dimensions, an XBRL reporting template may include the definition of one or more periods (via rule nodes specifying period aspects).
- Parameters can be used for dynamically defining the period aspect.
- Global parameter implementation is preferable, because then a parameter can be reused across tables.
- A comparative period date can be evaluated based on a parameter value using XPath 2.0 functions. This is especially useful when we know the exact offset between reference and comparative periods (e.g., 1 year, 6 months, 3 months).
5.9 Multi-period reporting within a single column (rule sets, tags, and tag selectors)
A common reporting scenario is a roll-forward disclosure, where opening and closing balances for an item are reported at the beginning and end of a period, and one or more changes are reported for the intervening period.
In a roll-forward disclosure, facts are reported using three different periods within a column: the instants at the start and end of the period, and the duration between them.
An example of a roll-forward disclosure is shown in Figure 10, a reduced version of a Statement of Changes in Equity. The Equity items on the rows are modelled as concepts. Equity is reported as a beginning and ending balance for two years and the changes in equity is reported with a duration period. This means the period aspect value is not constant within either columns or rows.
XBRL reporting templates provide a number of features in order to support this arrangement. These are explained in the example below.
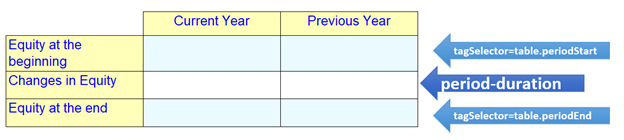 Figure 10: Statement of Changes in Equity
 Table definition for Figure 10:
|
Components |
Properties |
Aspects |
Labels |
|
Table |
tab09 |
|
|
|
Breakdown |
Axis = X |
|
|
|
Rule Node |
|
Period Duration Start ($refDate - xs:yearMonthDuration('P1Y') + xs:dayTimeDuration('P1D')")
|
Label (Current Year) |
|
Rule Set |
tag(table.periodStart) |
Period Instant ($refDate - xs:yearMonthDuration('P1Y')") |
|
|
Rule Set |
tag(table.periodEnd) |
Period Instant ($refDate) |
|
|
Rule Node |
|
Period Duration Start ($refDate - xs:yearMonthDuration('P2Y') + xs:dayTimeDuration('P1D')”)
|
Label (Previous Year) |
|
Rule Set |
tag(table.periodStart) |
Period Instant ($refDate - xs:yearMonthDuration('P2Y')) |
|
|
Rule Set |
tag(table.periodEnd) |
Period Instant ($refDate - xs:yearMonthDuration('P1Y')) |
|
|
Breakdown |
Axis = Y |
|
|
|
Rule Node |
tagSelector (table.periodStart) |
Concept (Equity) |
Label (Equity at the beginning) |
|
Rule Node |
|
Concept (ChangesInEquity) |
Label (Changes in equity) |
|
Rule Node |
tagSelector (table.periodEnd) |
Concept (Equity) |
Label (Equity at the end) |
|
|
|
|
|
|
Parameter |
|
|
|
|
|
name(refDate) |
|
|
|
|
type(date) |
|
|
|
|
required (false) |
|
|
|
|
default(2019-12-31) |
|
|
This example reuses the approach of using a "global parameter" to define the reporting period, as seen in the previous example. As before, XPath expressions will be used to calculate the exact date values for period aspects placed on table columns.
The main challenge in Figure 10 is that each row is reported with a different period. Let’s take the first column (Current Year):
- Equity at the beginning – the instant concept Equity reported at the period start date (2018-12-31)7
- Changes in equity – the duration concept ChangesInEquity reported period 2019-01-01 to 2019-12-31
- Equity at the end – the instant concept Equity, reported at the period end date (2019-12-31)
The aspects defined at the rule node, acts as the default for all its cells. The rule set construct defines variation in the aspects within the rule node.
Under the x-axis rule node in Figure 10, we have got three period variations: two instants and one duration. These three period variations can be addressed by defining aspects in two rule sets and at the rule node.
The aspects defined at the rule node specifies the duration period aspect. The instant period aspects are defined in the two "rule sets" under the rule node. For each rule set a name is specified in "tag" property. Here in this example tags are named as table.periodStart and table.periodEnd to indicate the purpose of a tag (highlighted). The same implementation will be done for a second rule node (column with comparative period) with exactly the same tag declarations.
Period aspects for each rule set (instant) and rule node (duration) is defined in a similar way as done in Figure 9 using global parameter and XPath expressions.
Tag on y-axis has needs to indicate which period aspect from column is to be applied in a particular row during table resolution. This is done using "tag selector" property with the "tag value". In this example for the last row the tag selector with value table.periodEnd is used on the last rule node (highlighted). This means the period aspect defined for rule set with tag table.periodEnd from the respective x-axis rule nodes will be applied across the last row.
Assuming refDate parameter has a value of 2019-12-31, the following will be the evaluated period aspect date for the last row.
- 2019-12-31 for the first column (Current Year)
- 2018-12-31 for the second column (Previous Year) (subtracted one-year interval from refDate).
Similarly, the first rule node on the y-axis uses a tag selector with value table.periodStart which means the period aspect defined for the rule set with tag table.periodStart will be applied.
The second rule node on the y-axis corresponding to the Changes in Equity row does not define any tag selector. This means that the row would inherit the default period aspect from the rule node on the x-axis which happens to be duration period aspect.
In this example we learnt:
- The rule set construct helps to define aspects that are not common across a row or column.
- We can use the rule set construct to define a roll-forward disclosure with a comparative period rule-set.
5.10 Multi-currency reporting within a single column (unit aspect, rule set, tag, tag selector)
The previous example showed how rule sets and tags can be used to vary the value of the period aspect within a column. In this section, we will demonstrate how a similar approach can be applied to other aspects.
For example, reports on exposure to currency risk often require the underlying exposure to be reported in the currency of the exposure as well as the primary currency of the report. An example of this is shown in Figure 11. The disclosure items are defined as concepts and the currency is expected to be reported in the unit aspect.
Each column in this table is reported in a different currency (EUR, USD), but the bottom row is always reported in GBP. This means that the currency is not common across all rows, or all columns.
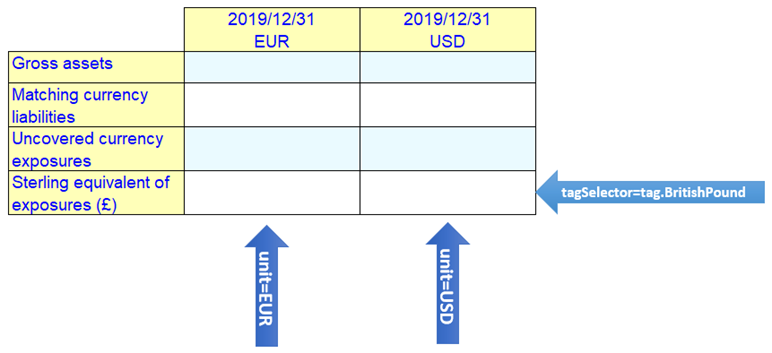 Figure 11: Foreign Currency Exposures
Table definition for Figure 11:
|
Components |
Properties |
Aspects |
Labels |
|
Table |
Tab10 |
|
|
|
Breakdown |
Axis = X |
|
|
|
Rule Node |
|
Unit (iso4217:EUR) |
Label (2019/12/31 |
|
Rule Set |
tag (BritishPound) |
Unit (iso4217:GBP) |
|
|
Rule Node |
|
Unit (iso4217:USD) |
Label (2019/12/31 |
|
Rule Set |
tag(BritishPound) |
Unit (iso4217:GBP) |
|
|
Breakdown |
Axis = Y |
|
|
|
Rule Node |
|
Concept (BankBalancesContractFeesReceivableAndOtherLiquidAssetsDenominatedInForeignCurrency) |
Label (Gross assets) |
|
Rule Node |
|
Concept (MatchingCurrencyLiabilities) |
Label (Matching currency liabilities) |
|
Rule Node |
|
Concept (UncoveredCurrencyExposures) |
Label (Uncovered currency exposures) |
|
Rule Node |
tagSelector (BritishPound) |
Concept (UncoveredCurrencyExposures) |
Label (Sterling equivalent of exposures (£)) |
The requirement here is to report value for Gross assets (row 1), Matching currency labilities (row 2) and Uncovered currency exposures (row 3) in two foreign currencies before conversion:
- column 1 – EUR
- column 2 – USD
Additionally, in row 4, the uncovered currency exposure is reported after conversion to the reporting currency (GBP).
In this example a rule set with the tag BritishPound is defined on x-axis rule nodes and instantiated on the y-axis rule nodes via a "tag selector" (highlighted). This construction results in the unit aspect with value GBP being applied to the last row and the respective default unit aspect values (EUR and USD) defined on the x-axis rule nodes are applied for other rows.
In this example we learnt:
- Rule sets can be applied to different aspects.
5.11 Repeating tables dynamically (dimension filter on z-axis)
In the example shown in Figure 7, we saw how a table can be repeated using the "z-axis". In some cases, there may be a long list of possible values for which a table can be repeated, but a filer may typically only need to report a small number of them. In this case, it is desirable to only repeat the table as many times as is required.
In this example, we will show how a table can be repeated dynamically based on user input.
Figure 12 shows an example in which off balance sheet exposures must be reported for each country in which the preparer has an exposure. The table could be repeated once for each country in the world, but preparers will typically only need to report a small number of countries.
In this table, Nominal amount and Provision are on columns and modelled as concepts; Loan commitment given and Financial guarantees given are on rows and modelled as domain members. The table is to be repeated for predefined countries based on user selection. The countries are modelled as domain members.
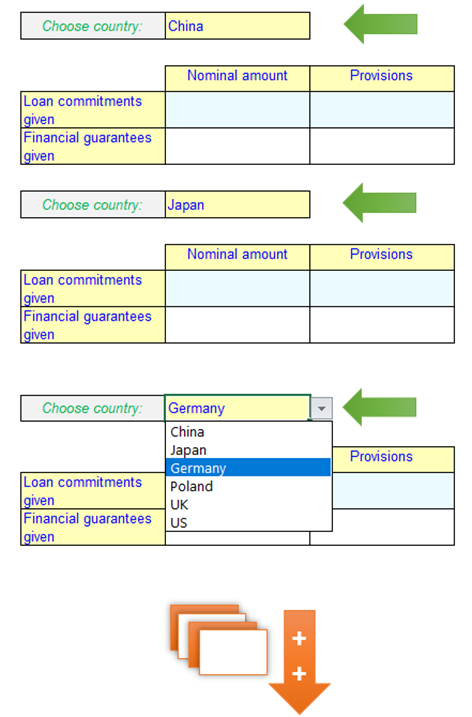 Figure 12: Off-balance sheet exposures by Country
Table definition for Figure 12:
|
Components |
Properties |
Aspects |
Labels |
|
Table |
tab11 |
|
|
|
Breakdown |
Axis = X |
|
|
|
Rule Node |
|
Concept (NominalAmount) |
Standard (Nominal amount) |
|
Rule Node |
|
Concept (Provisions) |
Standard (Provisions) |
|
Breakdown |
Axis = Y |
|
|
|
Rule Node |
|
Explicit Dimension (TypeOfProvisionDim = LoanCommitmentsGivenMember) |
Standard (Loan commitments given) |
|
Rule Node |
|
Explicit Dimension (TypeOfProvisionDim = FinancialGuaranteesGivenMember) |
Standard (Financial guarantees given) |
|
Breakdown |
Axis = Z |
|
Standard (Choose Country) |
|
Aspect Node |
|
Explicit Dimension Filter (CountriesDim) Axis (descendant) |
|
List of countries defined in a domain member tree used in Figure 12 are as below:
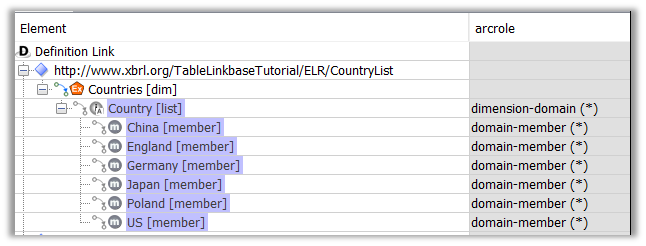 Figure 13
The requirement is to enable users to select countries for which tables have to be repeated. The repetition of the table is achieved by an aspect node on the "z-axis" breakdown.
The user input for countries has to be restricted to a predefined list of countries (domain members) which is done using an explicit dimension filter on the aspect node (highlighted).
The properties of the explicit dimension filter construct are shown below:
- "explicit dimension filter" – name of the dimension that is to be filtered. In this case it is CountriesDim
- "member" – specifies a "root" member of the dimension which, when combined with the axis, linkrole and arcrole properties, defines a set of allowed members. In this case, we want to select the full list of countries, so we use the root member, Countries [List]
- "linkrole" – URI of the linkrole in which the domain member tree is defined., in this case http://www.xbrl.org/TableLinkbaseTutorial/ELR/CountryList
- "arcrole" – For an explicit dimension filter this should be the standard arcrole http://xbrl.org/int/dim/arcrole/domain-member
- "axis" – specifies the required relationship between the the root member and the members to be selected. There are four possible options
- descendant - means children of all generations of the root member in the tree
- descendant-or-self - means children of all generations of the root member in the tree, including the root member
- child - means children of first generations of the root member in the tree
- child-or-self - means children of first generations of the root member in the tree, including the root member
In this case we want to include all countries in the list, but not the root member, so we use the "descendent" axis.
The rendered "z-axis" header is a drop-down list with all countries from the domain member tree.
The explicit dimension filter on z-axis can provide many benefits:
- The end user cannot enter wrong data as disallowed options won’t be displayed.
- The template re-uses the domain-member tree that is defined in the taxonomy. If the list in the taxonomy is updated, changes will automatically be reflected in the drop-down list in the template.
- The end user can control the number of copies of table generated (at an application level) to satisfy reporting needs and avoid redundant copies.
For Figure 12 table-specific header labels cannot be defined as done in Figure 7. This can be addressed by providing appropriate labels to dimension member elements in the taxonomy.
In this example we learnt:
- It is possible to repeat table with a predefined set of options using the explicit dimension filter construct.
5.12 Combining Open and Fixed Rows (combining aspect node and rule node)
In the example shown in Figure 5, we saw how rows can be added in a reporting template using an aspect node. In some cases, there is a requirement to have a static row after the open rows. Example in Figure 14 shows one such disclosure, in which the entity has to report details of its each investment and aggregate Fair Value (last column) as its last row. The reporting items on the columns are modelled as concepts. The investments identified with their ISIN code (modelled as typed dimension) are captured in the rows.
This example explains how the static row can be defined in addition to open rows
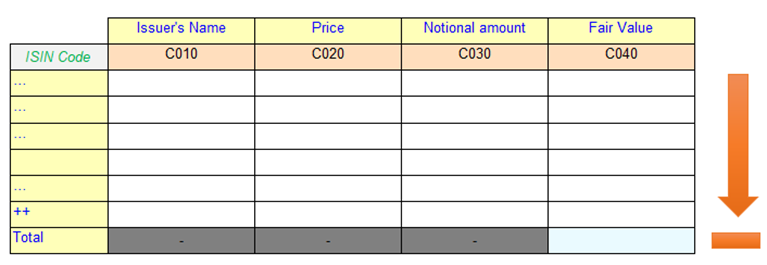 Figure 14: Portfolio disclosure
 Table definition for Figure 14:
|
Components |
Properties |
Aspects |
Labels |
|
Table |
tab12 |
|
|
|
Breakdown |
Axis = X |
|
|
|
Rule Node |
|
Concept (IssuerName) |
Standard (Issuer's Name) |
|
Rule Node |
|
Concept (MarketPrice) |
Standard (Price) |
|
Rule Node |
|
Concept (NominalAmount) |
Standard (Nominal amount) |
|
Rule Node |
|
Concept (FinancialAssetsAtFairValueThroughProfitOrLoss) |
Standard (Fair Value) |
|
Breakdown |
Axis = Y |
|
Standard (ISIN Code) |
|
Aspect Node |
|
Typed Dimension (InstrumentTDim) |
|
|
Rule Node |
|
|
Standard (Total) |
On the y-axis, first an aspect node is defined for capturing a value for the typed dimension Instrument dim. This is followed by a rule node definition. This specifies that preparers can report multiple investment products (add rows) and rule node at the end is provided for capturing the aggregate value. This approach is different to the previous examples, where both rule node and aspect node were not on the same breakdown axis.
It should be noted that the rule node on the y-axis is empty (no aspect was defined). The requirement for the highlighted cell is that it must not include the typed dimension value and have a concept. The concept defined on x-axis gets inherited to the highlighted cell, which means there are no additional aspects required to be defined on the y-axis rule node.
Issuer’s name, price and nominal amount can be reported only in relation to an investment (modelled as typed dimension here); reporting these without reference to a specific investment makes no sense. Value for Fair amount can be reported for individual instrument or as an aggregate value for all investments. This business requirement is defined in dimensional models in the taxonomy. The table resolution uses the dimension model to grey out the dimensionally invalid data points, and only valid data points are made available for user input.
Read the guidance How to identify dimensionally invalid data points in a taxonomy’ to know more dimension modelling.
In this example we learnt:
- It is possible to combine rule nodes and aspect nodes on a single breakdown. This gives a breakdown were some rows (or columns) are fixed, but others can be added as required by the data.
5.13 Reusing taxonomy relationship (concept and dimension relationship node)
In some cases, the reporting template mirrors what’s in the taxonomy. This example demonstrates how taxonomy relationships can be reused to define an XBRL reporting template.
Figure 15 presents an extract of a Disclosure of Impairment loss table. The classes of assets (on columns) are modelled as domain members and the disclosure items (on rows) are defined as concepts in the taxonomy.
An approach to define the Figure 15 is specifying each dimension member as a rule node on the x-axis and the concepts as rule-nodes on the y-axis. This example demonstrates an alternative approach of reusing taxonomy relationships to define the same table. This approach reduces the maintenance burden as the table layout will be updated automatically based on changes in the taxonomy relationship.
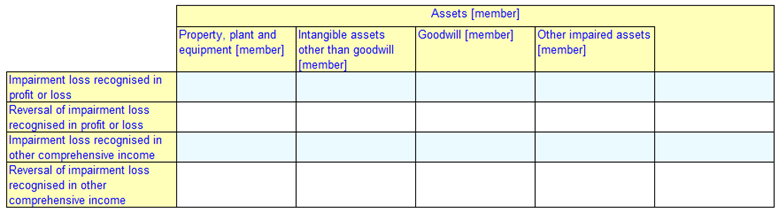 Figure 15: Disclosure of impairment loss
 Table definition for Figure 15:
|
Components |
Properties |
Aspects |
Labels |
|
Table |
tab13 |
|
|
|
Breakdown |
Axis = X |
|
|
|
Dimension Relationship Node |
|
Relationship Source (ClassesOfAssetsMember) |
|
|
Breakdown |
Axis = Y |
|
|
|
Concept Relationship Node |
|
Relationship Source (StatementOfImpairmentLossLineItems) |
|
A dimension relationship node is defined on the x-axis, specifying that the columns will be defined by the members of a domain-member tree.
The properties defined under the "dimension relationship node" specify the dimension members to be included. The "linkrole property" identifies the "URI of link role" where the relationship is defined. The "dimension property" identifies the explicit dimension (ClassesOfAssetsDim) whose members are to be resolved. The relationship source property specifies the member which will be considered as the root for selecting the dimension members.
"Formula axis" indicates the required relationship between root member (ClassesOfAssetsMember) and the selected member. Here the value specified is "descendant-or-self", which indicates that all descendants of the source member and the root member will be resolved. The other possible values for this attribute include child, child-or-self, sibling, sibling-or-self and descendant. The formula axis value with "-or-self" implies the root member will also be selected. The "generations" value specifies the nesting levels from the root member that need to be include. A value of zero specifies no limit.
A "concept relationship node" is defined on the y-axis, specifying that the concepts will be correspond to concepts selected from a relationship tree. A concept relationship node has similar properties to a dimension relationship node, but additionally, the concept relationship node defines an arcrole specifying the type of relationship used. In this example, the arcrole (http://www.xbrl.org/2003/arcrole/parent-child) indicates that the presentation tree is used.
The resolution of the domain member tree and the presentation tree results in the layout shown in Figure 15. The layout replicates the hierarchy defined in the taxonomy. It should be noted that, in this type arrangement it is not possible to specify individual labels for rows or columns. The standard labels or preferred labels (where defined) of the concepts and domain members are rendered as the labels for rows and columns.
This approach can also be useful in open reporting environments to generate XBRL reporting template from the extended taxonomies, where is it difficult to predefine a table.
In this example we learnt:
- Dimension and concept relationship defined in the taxonomy can be leveraged to build XBRL reporting template.
- This approach is suitable when the table replicates the taxonomy relationship hierarchy.
- This approach could find use cases in open reporting environment.
5.14 Combining taxonomy relationships re-use with multi-period reporting (ruleset and tag selector with concept relationship node)
In Figure 10 we saw how to specify different periods across rows using tags on specific rows. If we re-use taxonomy relationships, as in the previous example, we don’t have individual rule nodes to attach the tags to.
This example demonstrates how different period aspects can be defined along with re-use of taxonomy relationships.
Figure 16 represents an extract of "Statement of Changes in Equity". The components of Equity are modelled as dimension member defined as columns. The disclosure items are modelled as concepts defined as rows.
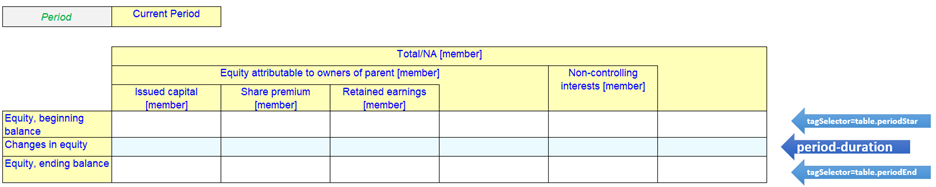 Figure 16: Statement of Changes in Equity
 Table definition for Figure 16:
|
Components |
Properties |
Aspects |
Labels |
|
Table |
tab14 |
|
|
|
Breakdown |
Axis = X |
|
|
|
Dimension Relationship Node |
|
Relationship Source (TotalNAMember) |
|
|
Breakdown |
Axis = Y |
|
|
|
Concept Relationship Node |
|
Relationship Source (StatementOfChangesInEquityLineItems) |
|
|
Breakdown |
Axis = Z |
|
|
|
Rule Node |
|
Period Duration Start ($refDate - xs:yearMonthDuration('P1Y') + xs:dayTimeDuration('P1D')") |
Standard (Current Period) |
|
Rule Set |
tag(table.periodStart) |
Period Instant ($refDate - xs:yearMonthDuration('P1Y')") |
|
|
Rule Set |
tag(table.periodEnd) |
Period Instant ($refDate) |
|
|
|
|
|
|
|
Parameter |
|
|
|
|
|
name(refDate) |
|
|
|
|
as (xs:date) |
|
|
|
|
required (false) |
|
|
|
|
select(2019-12-31) |
|
|
Figure 16 is defined using a dimension relationship node and a concept relationship node as explained for Figure 15 This layout represents a roll-forward example where the period aspects are different across the rows, similar to Figure 10.
Under this approach, rows are not explicitly defined, hence specifying the period aspect for each row is not possible. This scenario is addressed by defining a rule set (similar to Figure 10) on the z-axis (highlighted). There are two rule sets ("table.periodStart" and "table.periodEnd") for period aspect defined using the "global parameters".
The tag names "table.periodStart" and "table.periodEnd" have specific semantics when they are used in conjunction with relationship nodes. The tag "table.periodStart" will be instantiated for concepts in the presentation tree which has "periodStartLabel" as its preferred label. Similarly the tag "table.periodEnd" will be instantiated for concepts in the presentation tree which has "periodEndLabel" as its preferred label. For this reason, the tags in the rules set have to be named exactly as given in this example when working with concept relationship node.
In our example the concept corresponding to Equity- beginning balance is assigned a "periodStartLabel" as its preferred label on the presentation tree. This implies a period aspect defined for tag "table.periodStart" is resolved and instant date 2018-12-31 will be applied (assuming the value of global parameter is 2019-12-31).
Note that there is only one rule node define on the z-axis, indicating that the table will be resolved only once with aspects defined on z-axis inherited by all the cells in the table.
In this example we learnt:
- How multiple period aspect pertaining to period start and end date can be defined in conjugation with concept relationship node.
- How rule set can also be defined on the z-axis and be instantiated by either of x or y axis.
5.15 Repetitive Hierarchy (multiple breakdowns with rule nodes)
Using the constructs learned so far, we know that Figure 17 can be defined as simple hierarchy of rule-nodes on the y-axis. This example demonstrates an alternative approach that reduces the repetition of rule node definitions which can be very helpful when there is a large list of repetitive items.
Figure 17 is an extract of an Off-balance sheet exposures disclosure in which provision type (Loans commitments given and Financial guarantees given) is to be disclosed counterparty wise (such as Credit Institutions, Insurance undertakings and pension fund). The provision type and counterparties are modelled as dimension and the disclosure items are defined as concepts in the taxonomy.
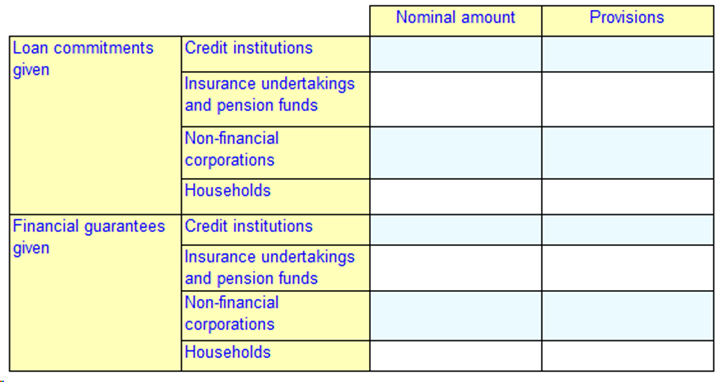 Figure 17: Off-balance sheet exposures
Table definition for Figure 17:
|
Components |
Properties |
Aspects |
Labels |
|
Table |
tab15 |
|
|
|
Breakdown |
Axis = X |
|
|
|
Rule Node |
|
Concept (NominalAmount) |
Standard (Nominal amount) |
|
Rule Node |
|
Concept (Provisions) |
Standard (Provisions) |
|
Breakdown |
Axis = Y |
|
|
|
Rule Node |
|
Explicit Dimension (TypeOfProvisionDim = LoanCommitmentsGivenMember) |
Standard (Loan commitments given) |
|
Rule Node |
|
Explicit Dimension (TypeOfProvisionDim = FinancialGuaranteesGivenMember) |
Standard (Financial guarantees given) |
|
Breakdown |
Axis = Y |
|
|
|
Rule Node |
|
Explicit Dimension (CounterpartyDim = CreditInstitutionsMember) |
Standard (Credit institutions) |
|
Rule Node |
|
Explicit Dimension (CounterpartyDim = InsuranceUndertakingsAndPensionFundsMember) |
Standard (Insurance undertakings and pension funds) |
|
Rule Node |
|
Explicit Dimension (CounterpartyDim = NonFinancialCorporationsMember) |
Standard (Non-financial corporations) |
|
Rule Node |
|
Explicit Dimension (CounterpartyDim = HouseholdsMember) |
Standard (Households) |
On the x-axis there are two rule nodes defined for respective concepts. There are two breakdowns defined for y-axis. The first y-axis breakdown has two rule nodes for Type of Provision domain members and the second y-axis breakdown has four rule nodes for Counterparty domain members.
When there are two breakdowns on the same axis (highlighted), the table resolution will resolve all combinations of nodes in the two breakdowns. In this example the two domain members (LoanCommitmentsGivenMember and FinancialGuaranteesGivenMember) on the first breakdown is combined with four dimension members of CounterpartyDim on the other breakdown to render eight rows as shown in Figure 17.
The resultant cells in the table will inherit aspects from both the rule nodes. The highlighted cell in this example will have its concept as NominalAmount inherited from x-axis rule node and following two explicit dimension members from the y-axis.
- TypeOfProvisionDim: LoanCommitmentsGivenMember
- CounterpartyDim: CreditInstitutionsMember
To be noted the rules nodes in multiple breakdown results in finite combinations and constrains a table to a fixed number of rows /columns, thus creating a fixed layout.
In this example we learnt:
- It is possible to define multiple breakdowns on the same axis to create combination of rules nodes resulting in a fixed layout.
- Aspects are inherited from all breakdown on the same axis.
- A multiple breakdown approach optimises table definition and is useful when there is a huge list of repetitive items.
5.16 Multiple open aspects on rows (multiple breakdowns with aspect nodes)
In Figure 5 and Figure 6 we saw table definition for a single open aspect. This example demonstrates table definition for combining two open aspects. This is required to address the ability to add rows where a row is identified by a combination of multiple values.
Let’s take example of Figure 18 which is an extract of "Portfolio disclosure". The investment products are identified by the combination of "ISIN code" and "Fund number". Both "ISIN code" and "Fund number" are modelled as typed dimension and the disclosure items (on the columns) are modelled as concepts.
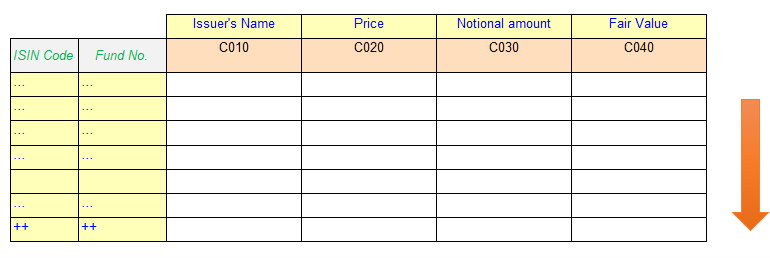 Figure 18: Portfolio-like disclosure
 Table definition for Figure 18:
|
Components |
Properties |
Aspects |
Labels |
|
Table |
tab16 |
|
|
|
Breakdown |
Axis = X |
|
|
|
Rule Node |
|
Concept (IssuerName) |
Standard (Issuer's Name) |
|
Rule Node |
|
Concept (MarketPrice) |
Standard (Price) |
|
Rule Node |
|
Concept (NominalAmount) |
Standard (Nominal amount) |
|
Rule Node |
|
Concept (FinancialAssetsAtFairValueThroughProfitOrLoss) |
Standard (Fair Value) |
|
Breakdown |
Axis = Y |
|
Standard (ISIN Code) |
|
Aspect Node |
|
Typed Dimension (InstrumentTDim) |
|
|
Breakdown |
Axis = Y |
|
Standard (Fund No.) |
|
Aspect Node |
|
Typed Dimension (PortfolioNumberTDim) |
|
The x-axis breakdown defines rule nodes for concepts. There are two y-axis breakdowns (highlighted). Each breakdown defines an aspect node for a typed dimension. The combination of two aspect nodes will result in an open layout as shown in Figure 18, enabling preparers to add rows and provide values for the two typed dimension columns.
As discussed in Figure 17 aspects from both the y-axis breakdowns aspect node will be applicable to the table cells across the row. The highlighted cell in this example will have its concept as "IssuerName" inherited from x-axis rule node and following two typed dimension from the y-axis.
- InstrumentTDim
- PortfolioNumberTDim
In this example we learnt:
- Multiple breakdowns with aspect nodes on the same axis can be used to input and render combination of aspect values.
5.17 Open rows with intermittent totals (breakdown with rule node and aspect)
In Figure 14 we saw the ability to add a static row at the end of the open rows. This example demonstrates the ability to add an intermittent static row and an alternative approach for combining two open aspects in the row.
Let’s take the example of Figure 19 which is an extract of a portfolio disclosure. The investment products are identified by the combination of "ISIN code" and "Fund number". It has an intermittent total row for each investment type. "ISIN code" and "Fund number" (on the rows) are modelled as typed dimensions and the disclosure items (on the columns) are modelled as concepts. Each investment is additionally qualified as either "shares" or "bonds" and identified by an explicit dimension member.
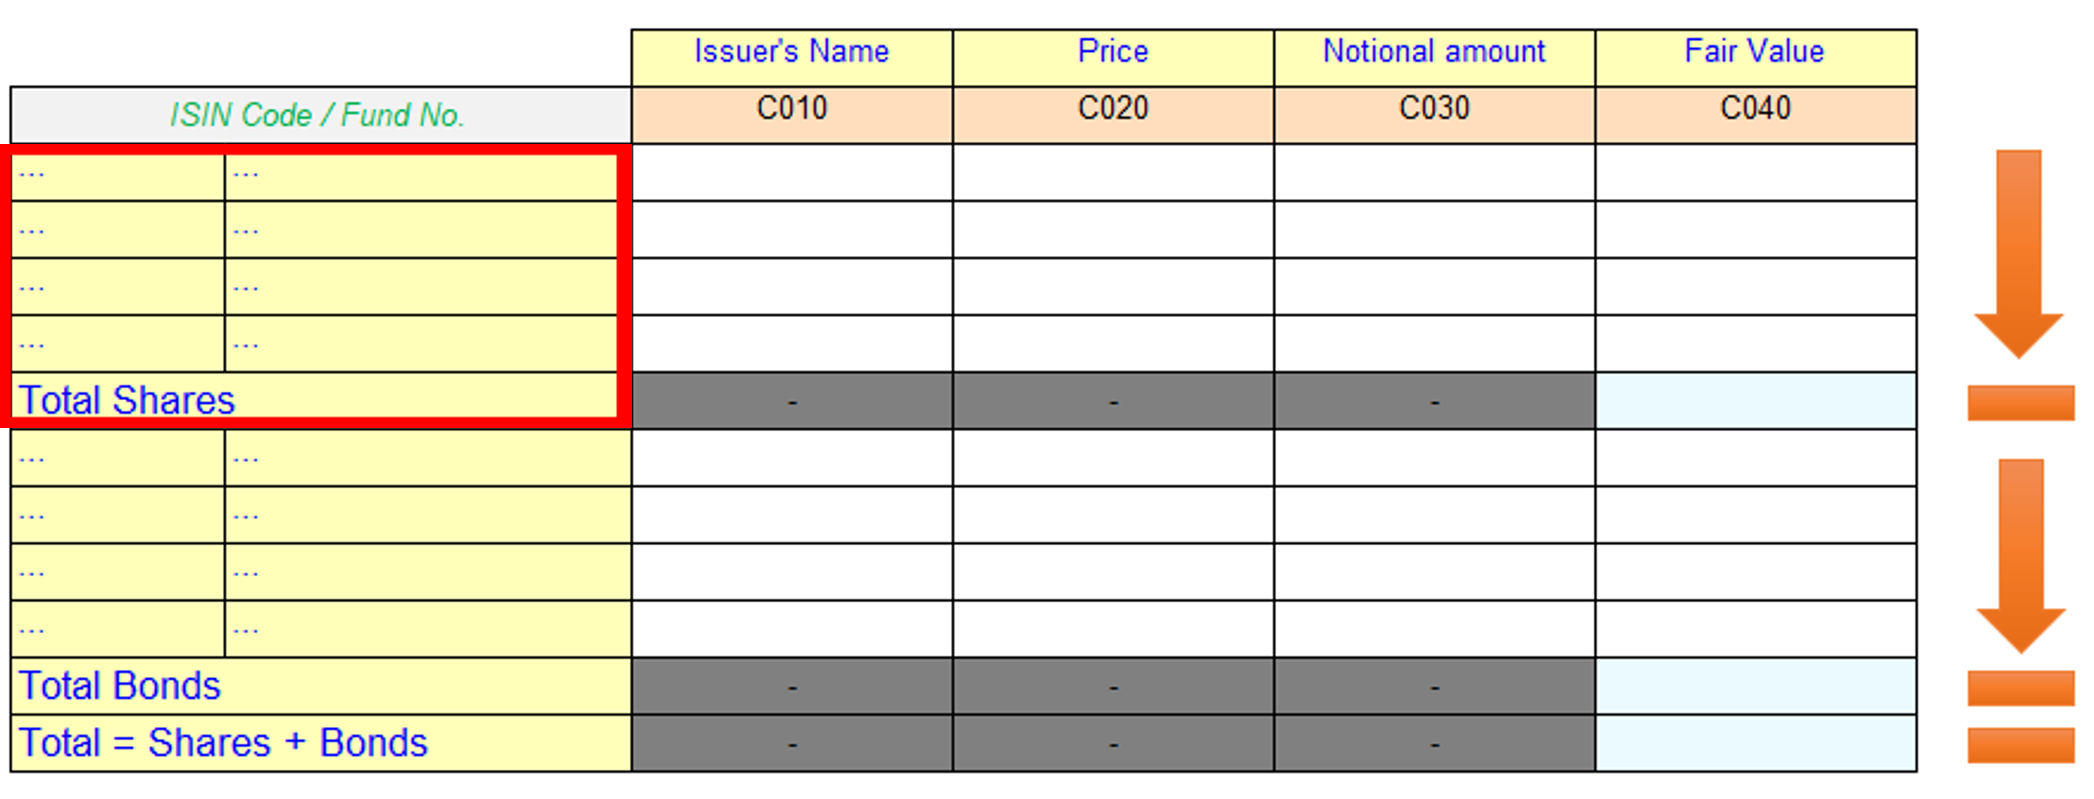 Figure 19: Portfolio-like disclosure
Table definition for Figure 19:
|
Components |
Properties |
Aspects |
Labels |
|
Table |
tab17 |
|
|
|
Breakdown |
Axis = X |
|
|
|
Rule Node |
|
Concept (IssuerName) |
Standard (Issuer's Name) |
|
Rule Node |
|
Concept (MarketPrice) |
Standard (Price) |
|
Rule Node |
|
Concept (NominalAmount) |
Standard (Nominal amount) |
|
Rule Node |
|
Concept (FinancialAssetsAtFairValueThroughProfitOrLoss) |
Standard (Fair Value) |
|
Breakdown |
Axis = Y |
|
Standard (ISIN Code / Fund No) |
|
Rule Node |
Abstract, Merge |
Explicit Dimension (TypeOfInstrumentDim = SharesMember) |
|
|
Aspect Node |
|
Typed Dimension (InstrumentTDim) |
|
|
Aspect Node |
|
Typed Dimension (PortfolioNumberTDim) |
|
|
Rule Node |
|
|
Standard (Total Shares) |
|
Rule Node |
Abstract, Merge |
Explicit Dimension (TypeOfInstrumentDim = BondsMember) |
|
|
Aspect Node |
|
Typed Dimension (InstrumentTDim) |
|
|
Aspect Node |
|
Typed Dimension (PortfolioNumberTDim) |
|
|
Rule Node |
|
|
Standard (Total Bonds) |
|
Rule Node |
|
|
Standard (Total = Shares + Bonds) |
There is only one y-axis breakdown defined unlike for Figure 18 where multiple breakdowns are defined for each aspect node.
The highlighted block of cells in Figure 19 pertains to Shares, where users can add rows as required and report a total at the end. The following section explains the table definition for the highlighted shares region of the table.
On the y-axis a rule node is created specifying explicit dimension TypeOfInstrumentDim with the value SharesMember. This rule node defines additional properties "Abstract" and "Merge". The "Merge" property specifies that the rule node will not be rendered in the layout however the aspects defined will be inherited by its children node. This construction is helpful in this example as the table does not expect a header row for the Shares block (highlighted block), however a placeholder to define common aspects for the block is needed.
The abstract property is applied to the rule node to satisfy the requirement of the specification which requires the merge property to be specified only for abstract rule nodes. To be noted labels cannot be defined for merged nodes as these would not be rendered.
Under the abstract merged rule node, an aspect node is defined to capture a value for typed dimension InstrumentTDim, followed by child aspect node for typed dimension "PortfolioNumberTDim". Following the principles of inheritance from the parent node the cell across the row (for shares block) will have one explicit dimension TypeOfInstrumentDim with value SharesMember and following two typed dimensions
- InstrumentTDim
- PortfolioNumberTDim
The rule node definition that follows enables capturing of aggregate value for the Fair value for total shares row. This rule node is a child of abstract merged rule node hence will also inherit the explicit dimension TypeOfInstrumentDim with value SharesMember. The greyed cells are as result of dimensionally invalid data points (see [][table12]).
Further on the y-axis a similar the construction is repeated for Bonds. There last rule node on the y-axis represents the total of Shares and Bonds value.
It should be noted that in this approach only single label is assigned at the breakdown level referring both typed dimension in the aspect node, as aspect nodes cannot be assigned labels of its own.
In this example we learnt:
- Feature of merged rule node, which contributes only its aspects to the children nodes and is not considered for table resolution.
- Nesting of aspect node with a rule node to capture totals creating multiple open rows and fixed last row.
- Application of principle of aspect inherence to aspect nodes.
5.18 Simple, single column templates
Some disclosures resemble a simple list, with a single fact reported for each item in the list. Such disclosures are often found in report headers or cover sheets, where preparers provide information about the report, such as the name of the reporting entity or the period for the report.
This example demonstrates how such templates can be created using a single y-axis breakdown. Figure 20 shows a list of general information for a Financial Statement reports. All disclosure items are modelled as concepts.
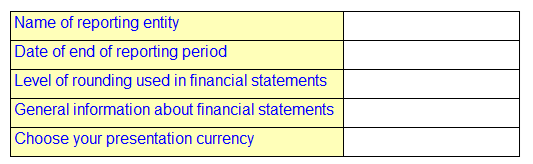 Figure 20: List of General Items
Table definition for Figure 20:
|
Components |
Properties |
Aspects |
Labels |
|
Table |
tab19 |
|
|
|
Breakdown |
Axis = Y |
|
|
|
Rule Node |
|
Concept (NameOfReportingEntity) |
Standard (Name of reporting entity) |
|
Rule Node |
|
Concept (DateOfEndOfReportingPeriod) |
Standard (Date of end of reporting period) |
|
Rule Node |
|
Concept (LevelOfRoundingUsedInFinancialStatements) |
Standard (Level of rounding used in financial statements) |
|
Rule Node |
|
Concept (GeneralInformationAboutFinancialStatementsExplanatory) |
Standard (General information about financial statements) |
|
Rule Node |
|
Concept (PresentationCurrency) |
Standard (Choose your presentation currency) |
Here there is only one y-axis breakdown defined, with rule nodes specifying the concept. Since an x-axis breakdown is not present, the cells in Figure 20 do not inherit any aspect other than the concept. While using XBRL reporting template for XBRL report creation, software applications will enable preparers to provide other required aspects such as period.
Alternatively, missing aspects can also be defined in y-axis rule nodes to ensure facts are reported/rendered using the correct aspects. It should be noted that Figure 20 does not include a column header, which is generally derived from labels of the rule nodes on the x- axis
In this example we learnt:
- It is possible to define a XBRL reporting template with one axis to create a simple, single-column form
5.19 Optional taxonomy-defined dimension(s) for open reporting scenarios ("Include Unreported Value" attribute)
In the previous examples we were dealing with open aspects which were mandatory to be reported in the table. If we take an example of Figure 5, the data entry will not be complete unless the value for ISIN code (a typed dimension) is provided. In the rendering use case, the table will render only facts qualified by the typed dimension - ISIN code.
Some business templates do not mandate reporting of all dimensional breakdown. This example demonstrates the ability of XBRL reporting template to define optional dimensions.
Let us take the example of related party transaction template in Figure 21. For transactions above a threshold limit the disclosure requires individual related party wise breakdown of transaction amount. The Relationship of Related Party(ies) is modelled as an explicit dimension having domain members such as Subsidiary, Associate or Holding. The Related Party LEI (Legal Entity Identifier) is a modelled as a typed dimension to capture LEI of individual party. The disclosure details of the transactions are defined as concepts in the taxonomy.
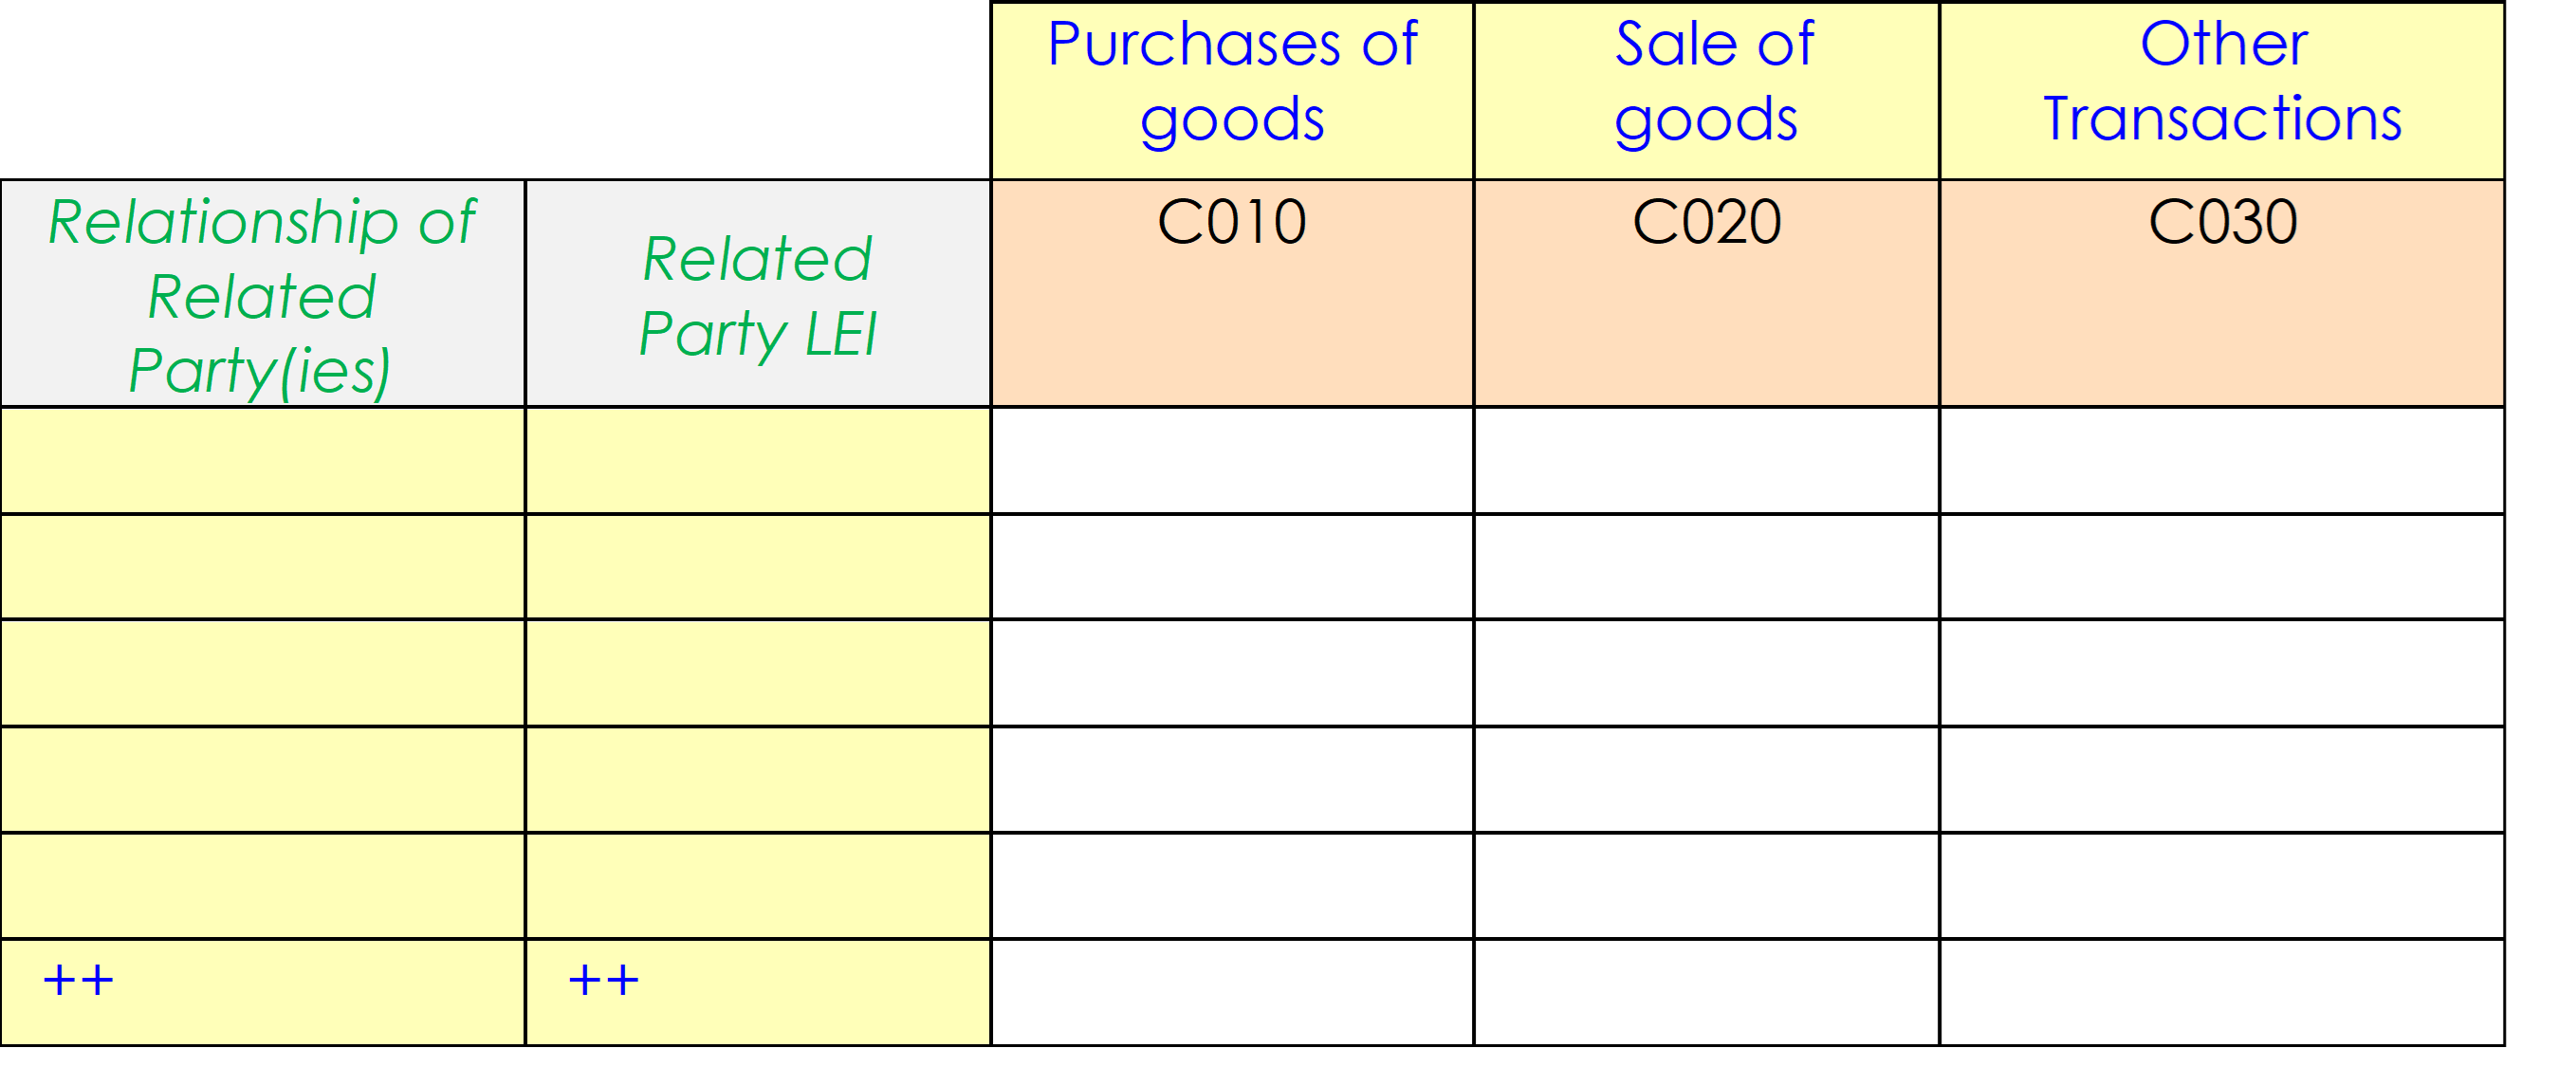 Figure 21: Abridged Related Party Transcation Disclosure
Table definition for Figure 21:
|
Components |
Properties |
Aspects |
Labels |
|
Table |
Tab20 |
|
|
|
Breakdown |
Axis = X |
|
|
|
Rule Node |
|
Concept (PurchaseOfGoods) |
Standard (Purchases of goods) |
|
Rule Node |
|
Concept (SaleOfGoods) |
Standard (Sale of goods) |
|
Rule Node |
|
Concept (OtheTransacations) |
Standard (Other Transactions) |
|
Breakdown |
Axis = Y |
|
Standard (Relationship of Related Party(ies)) |
|
Aspect Node |
|
Explicit Dimension Filter (RelationshipOfRelatedPartyDim) Axis (descendant) |
|
|
Breakdown |
Axis = Y |
|
Standard (Related Party LEI) |
|
Aspect Node |
|
Typed Dimension (RelatedPartyLEITDim); Include Unreported Value |
|
The first breakdown on the y-axis defines an aspect node for Relationship of Related Party(ies) using explicit dimension filters. The aspect node allows prepares to add rows making it an open layout. The explicit dimension filters allow prepares to select the relationship of related party available as domain members from a predefined list as explained in Figure 12.
The second breakdown on the y-axis defines the typed dimension for capturing LEI of the related party. We had noted at the beginning that all preparers may not be required to report this dimension. This optional nature of the dimension is specified using an attribute "Include Unreported Value" (highlighted). This attribute specifies that in this table, preparers can skip reporting this dimension or facts can be rendered without being qualified by this dimension.
It should be noted that the "Include Unreported Value" attribute can only be used in aspect nodes for taxonomy-defined dimensions. This attribute cannot be used for entity, unit, period or concept.
The optional nature of explicit dimension defined using this attribute is same as allowing to report dimension default. In this example we learnt:
- The optional nature of a taxonomy-defined dimension breakdown can be defined using the "Include Unreported Value" attribute on the aspect node.
5.20 Restricting facts in Table Rendering (Table Filters)
In some cases, a reporting template may be only relevant for specific scenarios. This example demonstrates how table filters can be used to restrict facts.
Figure 22 represents the Assets across geography for the current year disclosure. This is similar to Figure 1; however, the rendering must be restricted to the current period only.
 Figure 22: Assets across geography for the current year
 Table definition for Figure 22:
|
Components |
Properties |
Aspects |
Label |
|
Table |
tab21 |
|
Assets across geography for the current year |
|
Breakdown |
Axis = X |
|
|
|
Rule Node |
|
Explicit Dimension (OperatingSegmentDim = EuropeMember) |
Europe |
|
Rule Node |
|
Explicit Dimension (OperatingSegmentDim = AmericaMember) |
America |
|
Rule Node |
|
Explicit Dimension (OperatingSegmentDim = AsiaMember) |
Asia |
|
Rule Node |
|
Explicit Dimension (OperatingSegmentDim = AustraliaMember) |
Australia |
|
Breakdown |
Axis = Y |
|
|
|
Rule Node |
|
Concept (Assets) |
Assets |
|
|
|
|
|
|
Parameter |
|
|
|
|
|
Name(refDate) |
|
|
|
|
type (date) |
|
|
|
|
required (false) |
|
|
|
|
default(2019-12-31) |
|
|
|
|
|
|
|
|
Table Filter |
Complement (FALSE) |
|
|
|
Period-instant filter |
$refDate |
|
|
The table defines a "table-filter" which connects to a "period-instant filter". This means that when rendering an XBRL report, only facts that satisfy the defined conditions in the filter will be included in the rendering. The period-instant filter node includes a direct reference to the parameter ($refDate). The value supplied for this parameter will be used as period value for filtering the facts to be rendered on this table. This is in addition to aspect constraints defined in the rule nodes. The table filter has a "complement" property that, when set to TRUE, inverts the filter's results.
The table filtering mechanism can also be used for the following use cases:
- To restrict concepts /dimensions (using concept and dimension filters) on open nodes.
- To restrict specific reporting currency (using unit filters).
- To render table, based conditions. For example, Statements of financial position table can be rendered based on Current and Non-current or Order of liquidity; where the category is available as a parameter value or concept value.
In this example we learnt:
- Table filters can be used to restrict the rendering of facts.
6 Appendix A Table Linkbase examples
The Table Linkbase examples used in this tutorial are available for download here as a taxonomy package: table-linkbase-tutorial-taxonomy-2019-11-30.zip
-
‘Table Linkbase’ is a common term used for referring to templates created using the XBRL Table Linkbase specification. This tutorial introduces a business-friendly term ‘XBRL Reporting Template’ for such templates. ↩
-
This tutorial follows the Table Linkbase specification in using the term 'aspect'. However, the term 'dimension' is now the preferred terminology. ↩
-
In the Table Linkbase syntax, references to taxonomy elements are done using QNames, which capture both the element's name and namespace. For simplicity this document will refer to elements using just their name. ↩
-
(https://www.w3.org/TR/xmlschema-2/#built-in-datatypes)[https://www.w3.org/TR/xmlschema-2/#built-in-datatypes] ↩
-
https://www.w3.org/TR/xpath20/ ↩
-
https://www.w3.org/TR/2012/REC-xmlschema11-2-20120405/datatypes.html#yearMonthDuration ↩
-
When a date is used as the start date for a period, it is interpreted as meaning the instant at the start of that day. This makes it equivalent to a period end or instant period specifying the previous day, as this is interpreted as referring to the instant at the end of the day. In this example, a start date of "2019-01-01" is the same as an end date or instant of "2018-12-31" ↩
This document was produced by the Best Practices Board.
Published on 2026-02-04.


