Data as Art
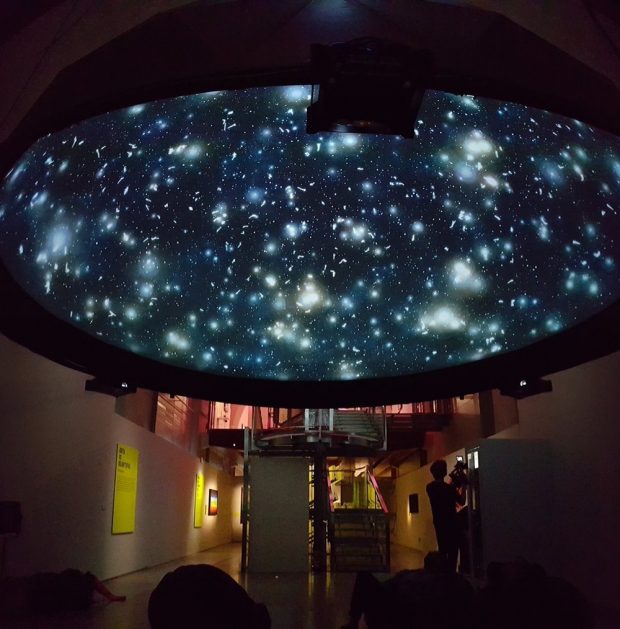
What do you see when you visualise data? Artists Joshua Portway and Lise Autogena saw stars, and created a “Stock Market Planetarium” that projects real-time stock market activity as stars in the night sky, flickering and glowing as individual stocks are traded around the world, and moving in concert with broader market activity and outlining shapes of different industries and multinational conglomerates like the signs of the zodiac.