
Reportix: Use Inline XBRL to make Pandemic Data Usable
A report this week used structured data to give machine-readable insight into the Covid-19 pandemic.
Reportix co-founder and CEO Dennis Münkle used some lockdown time this week to ask an incredibly obvious question: Why can’t we easily access and reuse the data that underpins the analysis being used to help manage our health and economies?
Analysis and charts about the spread of Covid-19, testing rates, hospitalisation levels and the numbers of deaths dominate every type of discussion and media right now. But only some of the raw data is available.
In truth, an awful lot of information is distilled from data that is often too hard to access.
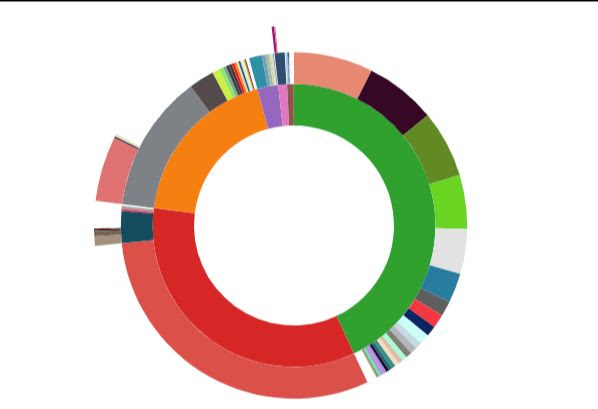
Dennis and his colleagues have taken some of the (accessible) data that exists and republished it in Inline XBRL format, together with graphs drawn from the same data set.
Providing raw data in a machine readable format, combined — as with Inline XBRL — with clear definitions, could be, and arguably should be, the default approach to a huge amount of analysis. Analysis that is published by public authorities, statistics agencies and scientific journals alike could have the raw data that has been used in its creation embedded on the web page in which it appears. Whether the table is visible, as in Dennis’ examples, or hidden but accessible would hardly matter. Open data approaches of this sort could and should be held up us as best practice that will enhance the utility of expert analysis as well as the quality of, and rigour with which, critical data is prepared.
Read more and access the report here.