
xBRL-CSV and Granular Data: the AnaCredit example, a Proof of Concept from XBRL Europe

This is a guest post by Vincent Le Moal-Joubel, data scientist and XBRL expert at the Banque de France, based on his presentation at the 28th XBRL Europe Digital Week event on Bank & Insurance reporting, on 23 June 2021. He offers an important proof of concept on the use of xBRL-CSV for European reporting. xBRL-CSV is one of the new formats offered within the Open Information Model (OIM) suite of specifications, and is ideal for handling large amounts of detailed information. Read on (and click to see images at full size), watch along with the video of the presentation here, or see the slides here.
On behalf of the XBRL Europe Bank and Insurance Working Group, I would like to present our work so far on how the xBRL-CSV format can be used to handle granular data, within an increasingly integrated reporting approach. Our proof of concept suggests that xBRL-CSV could streamline the reporting process and facilitate users in comparing and analysing information from across different countries and reporting requirements, including extensive and detailed data.
We wanted to look at an existing reporting initiative that is known for producing very large volumes of data, and therefore took AnaCredit as our example. AnaCredit – standing for ‘analytical credit datasets’ – is a European Central Bank (ECB) project requiring the reporting of detailed information on individual bank loans throughout the euro area. As you might expect, this represents a huge quantity of data.
AnaCredit was launched in 2011, although the first filings were not made until 2018. Even early on, we were interested in using AnaCredit as a case study, but at that time we did not have the data point modelling (DPM) tools that we have today, and xBRL-CSV was not even thought of. It was therefore then too early to adapt AnaCredit to XBRL, but we now have very different capabilities at our disposal. Our goal is not to effect a change in AnaCredit reporting, but to use it as an example of how we can handle this amount of data, and test it against our processes.
Data point model to connect data with meaning
Our first step was to capture the definitions used for AnaCredit. One of the difficulties we faced was that these definitions are not exactly the same everywhere, as each country has decided different reporting processes. That means that, for software providers, working on AnaCredit across Europe is a nightmare because the rules change from country to country.
Our solution was to apply a data point model to the data and the filing rules attached to it. A DPM connects the human-readable reporting template with the technical definitions in the XBRL taxonomy, giving reporting concepts machine-readable meanings.
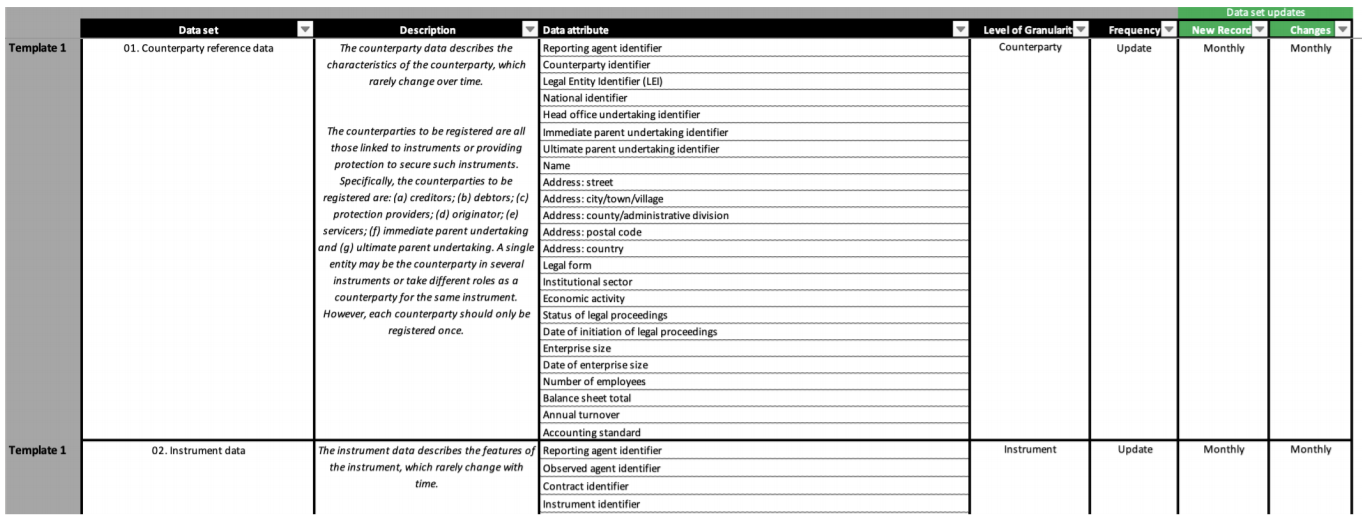
Figure 1: AnaCredit reporting template for ‘Counterparty reference data’ data set.
Figure 1, for example, shows the AnaCredit reporting template for ‘Counterparty reference data,’ with a list of fields for filers to use. Our task was to identify the data and create concepts to go with each fact – or, ideally, take existing concepts used in other reporting, for example by the European Banking Authority (EBA).
Figure 2 shows the counterparty reference data reporting requirements converted into the DPM, producing an annotated template in table format. It also comes with a dictionary of concept definitions and their origins. This combines specific concepts that we developed for AnaCredit with imported EBA concepts, such as the definition of the Legal Entity Identifier (LEI) code, which is already deployed in EBA reporting.
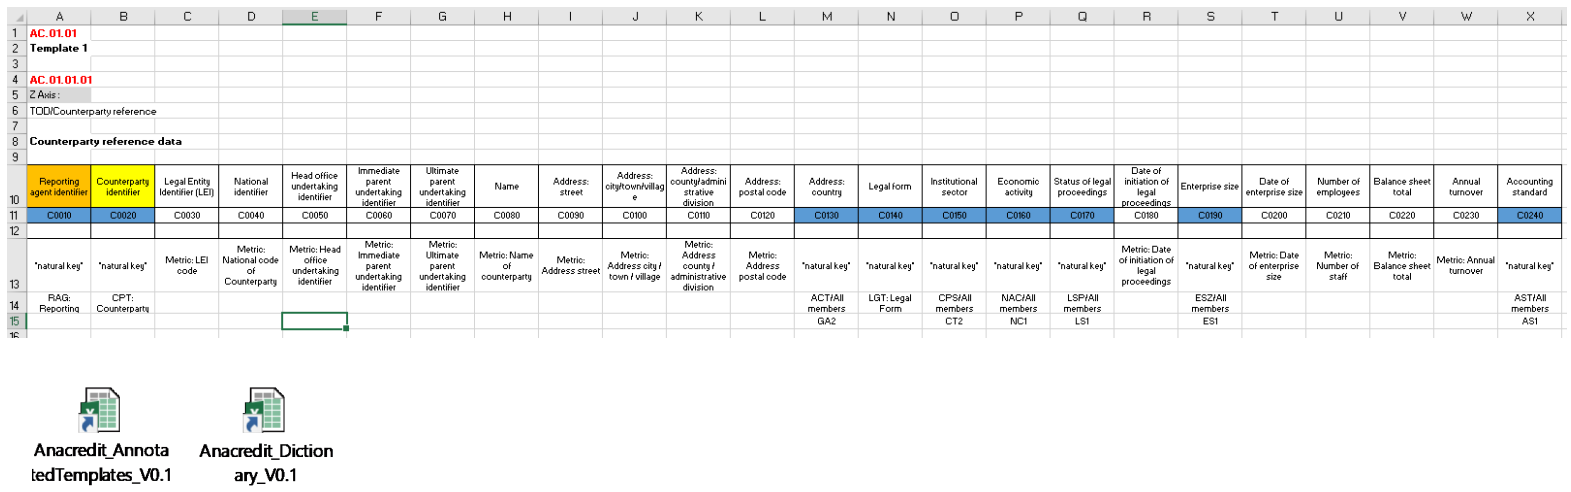
Figure 2: DPM table for counterparty reference data.
One of the complications is that the way in which Anacredit data is actually reported varies considerably between countries. Figure 3 shows some examples taken from real digital reports from different countries. We can see that if we take the ‘Number of employees’ item (circled in red), in Germany this concept is named “NMBR_EMPLYS”, in France “NUMBR_EMPLY”, and in Italy “NumberOfEmployees.” The DPM allows us to successfully link all of these to the underlying concept.
While all of these countries use XML for reporting, the structure of the code is very different. Finally, some countries also have additional national reporting requirements, reflected in additional fields. For example, in France filers are also required to report the SIREN, a national identifier, for each counterparty (circled in purple). The Aim of the working group was to see how these issues could be addressed.
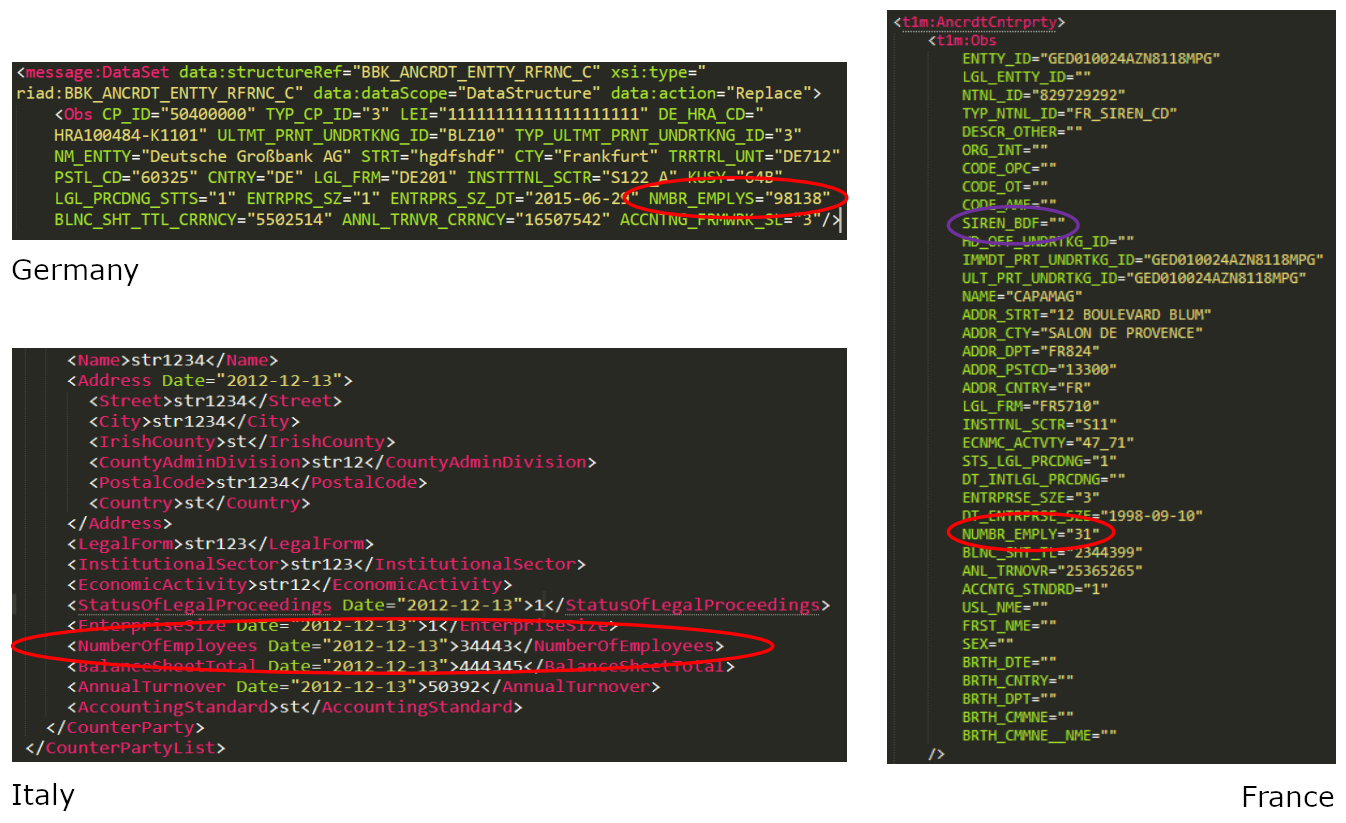
Figure 3: Examples of differences in Anacredit reporting between countries.
Advantages of XBRL
The most important benefit XBRL brings is standardisation of data. The shared dictionary and concepts guide filers on how to correctly report each fact and ensure that the data is comparable. Importantly, the data is easily generated and consumed using familiar XBRL tools, which are already in place for current reporting in most banks and national competent authorities (NCAs) across Europe.
XBRL also provides extensibility. Individual countries or regulators can extend the taxonomy to add specific fields to capture their own reporting requirements. Banque de France, for example, adds additional fields to the European Pension Fund reporting template. Using XBRL, these are easily handled and the extra data is filtered out before sending to the European Insurance and Occupational Pensions Authority (EIOPA). In other words, XBRL gives us a standard way to add custom fields as needed, without impacting the integrity of the core shared reporting. At the same time, the ability to reuse existing concepts helps facilitate comparison and analysis of data from across different reports.
Figure 4 shows a user-friendly visualisation of a few lines from an AnaCredit XBRL report, displayed as specified in our proof-of-concept taxonomy. A standard XBRL tool can produce this visualisation using information embedded in the report package. Another advantage of XBRL is with the ability for users to determine how the digital data is presented, potentially using different or modified templates. Of particular interest in polyglot Europe is the potential to natively integrate multiple languages to display table labels and concepts, and allow viewers to automatically switch from one language to another. This is already being done for Single Resolution Board (SRB) reporting, for example, where the taxonomy is available in different languages.
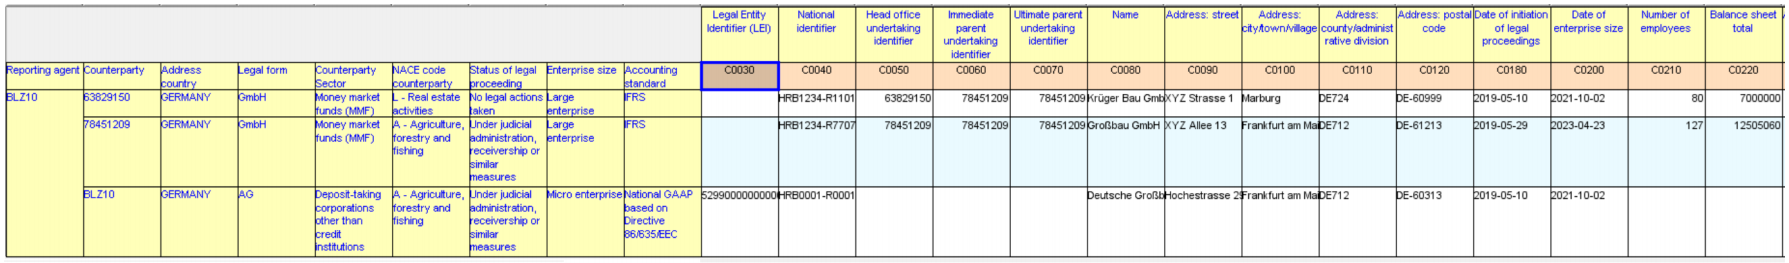
Figure 4: Visualisation of an AnaCredit XBRL report using the presentation specified in the taxonomy.
The last, but not least, key benefit of XBRL is the potential for validation to check data, catch issues, and improve quality. Validation rules can be natively defined and implemented to run on standard XBRL tools. Validation outcomes depend on levels of precision set for the data; the ability to adjust these adds sensitivity to the validation controls.
Advantages of xBRL-CSV
On top of the general benefits of XBRL, the most important additional advantage of xBRL-CSV is that it produces dramatically smaller files, making reports substantially easier to produce, handle, send and store. Figure 5 shows a comparison of two reports, with the same data captured in traditional, XML-based XBRL 2.1 and in xBRL-CSV formats. Even without a great deal of technical knowledge, it is clear that in the XML report the metadata is taking up a lot of space, and the reported data – shown in white – is only a fraction of the content of the code. The data in xBRL-CSV is notably more compact.
Overall, using xBRL-CSV for AnaCredit data reduces file size by almost a factor of ten, in a linear ratio. For example, a table with 300,000 rows produces a 62 Mb file in xBRL-CSV and a 574 Mb file in XBRL 2.1. For a table with 3,000,000 rows those numbers are 622 Mb and 5,744 Mb respectively.
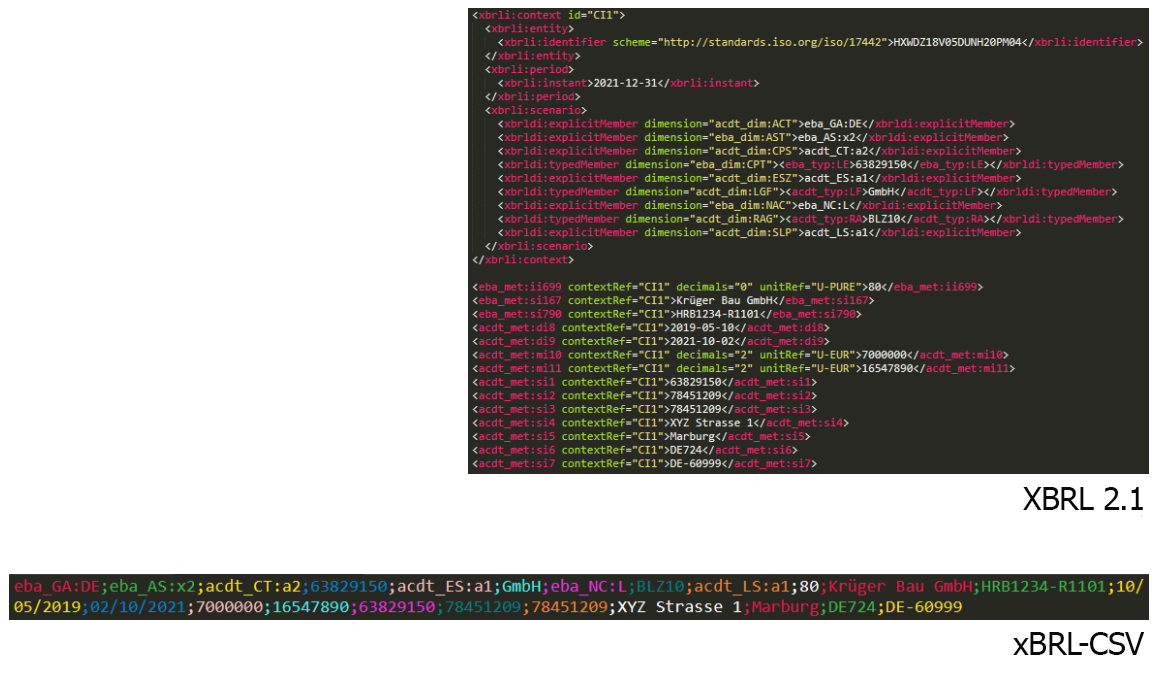
Figure 5: Comparison of XML-based XBRL 2.1 and xBRL-CSV reports.
xBRL-CSV files are also easily readable and editable. All the data is contained in a simple CSV file or files, while the metadata are defined in a very small separate JSON file, as are table properties. This makes it easy for filers and other users to focus on the data; it is very straightforward to access specific data and to edit the CSV files without XBRL knowledge, using widespread and familiar tools. This rapid access to data also potentially facilitates the validation process.
A basis for experimentation
This proof of concept gives us a good basis to prepare for integrated reporting of more granular data, including insights into how to proceed with experiments on large volumes of real data, and how to meet validation needs and challenges. As I mentioned, we are not working to change AnaCredit per se, but to understand how to apply xBRL-CSV to large datasets to streamline reporting.
This is only the beginning of our work, and we intend it to serve as a basis for more experimentation. Some of our next steps might include adding more AnaCredit tables to the DPM, which would also allow us to test and analyse existing AnaCredit validation controls between and within tables, as well as implementing and assessing further compatible validation. We would also like to add multi-language labels to illustrate this functionality, and to experiment with real anonymised data if possible.
There is no doubt that trends in reporting are moving towards the collection of larger volumes of more granular data, but this data is meaningless unless it can be handled and analysed effectively. So far, xBRL-CSV appears to offer an efficient and practical solution for future reporting, particularly in bringing together and making sense of information from varied jurisdictions.