
xBRL-JSON Makes Report Consumption Easier!

Revathy manages the development of guidance materials at XBRL International. In this article she shares the xBRL-JSON driven analytics that she demonstrated at last week’s Data Amplified conference, with links to explore.

The new Open Information Model (OIM) specifications will soon reach ‘Recommendation’ status. There is no time like the present, therefore, to learn how the new set of specs is going to impact the XBRL reporting supply chain. One key thing to bear in mind is that it is now possible to convert – losslessly – between different XBRL formats. For example, you can go from xBRL-XML to xBRL-JSON and back again.
xBRL-JSON is designed to make XBRL report consumption easy. Traditional xBRL-XML reports are not straightforward to consume. The new xBRL-JSON format is a simpler and vastly more intuitive representation of XBRL reports which, amongst other things, means that off-the-shelf BI and analytic tools can quickly understand XBRL data. Or at least, that’s what my colleagues here at XBRL International say!
As a business user – I’m not a coder! – I needed to try it myself to understand this claim. You can read more about my initial experiment with xBRL-JSON here.
For the current experiment, I took ESEF (EU), EDINET (Japan) & EDGAR (US) Inline XBRL filings and converted them into xBRL-JSON format (courtesy of the open source Arelle tool). These converted xBRL-JSON reports were then analysed in three tools: Tableau, Google Data Studio and Excel 365.
I discovered that the tools could recognise the XBRL facts and their associated dimensions (aspects), parse them into their model, and make it available for the user to set up tables and data visualisations. Graphs could be created by simply selecting the dimensions and filtering for specific values. The analysis was not restricted to single filings; the reports spanned across multiple periods and entities.
Following are a few extracts from the sample analysis done using xBRL-JSON reports.
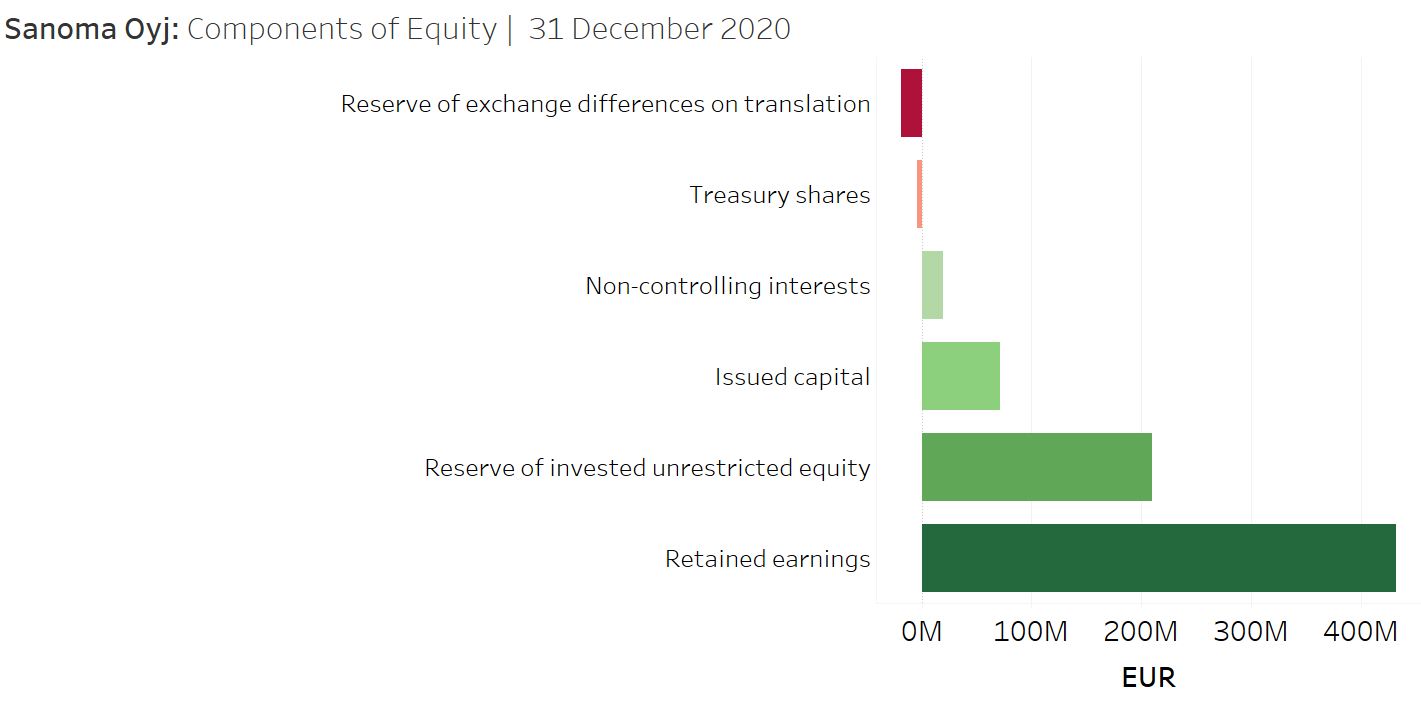
Figure 1: Components of Equity Break-up | Sanoma Oyj
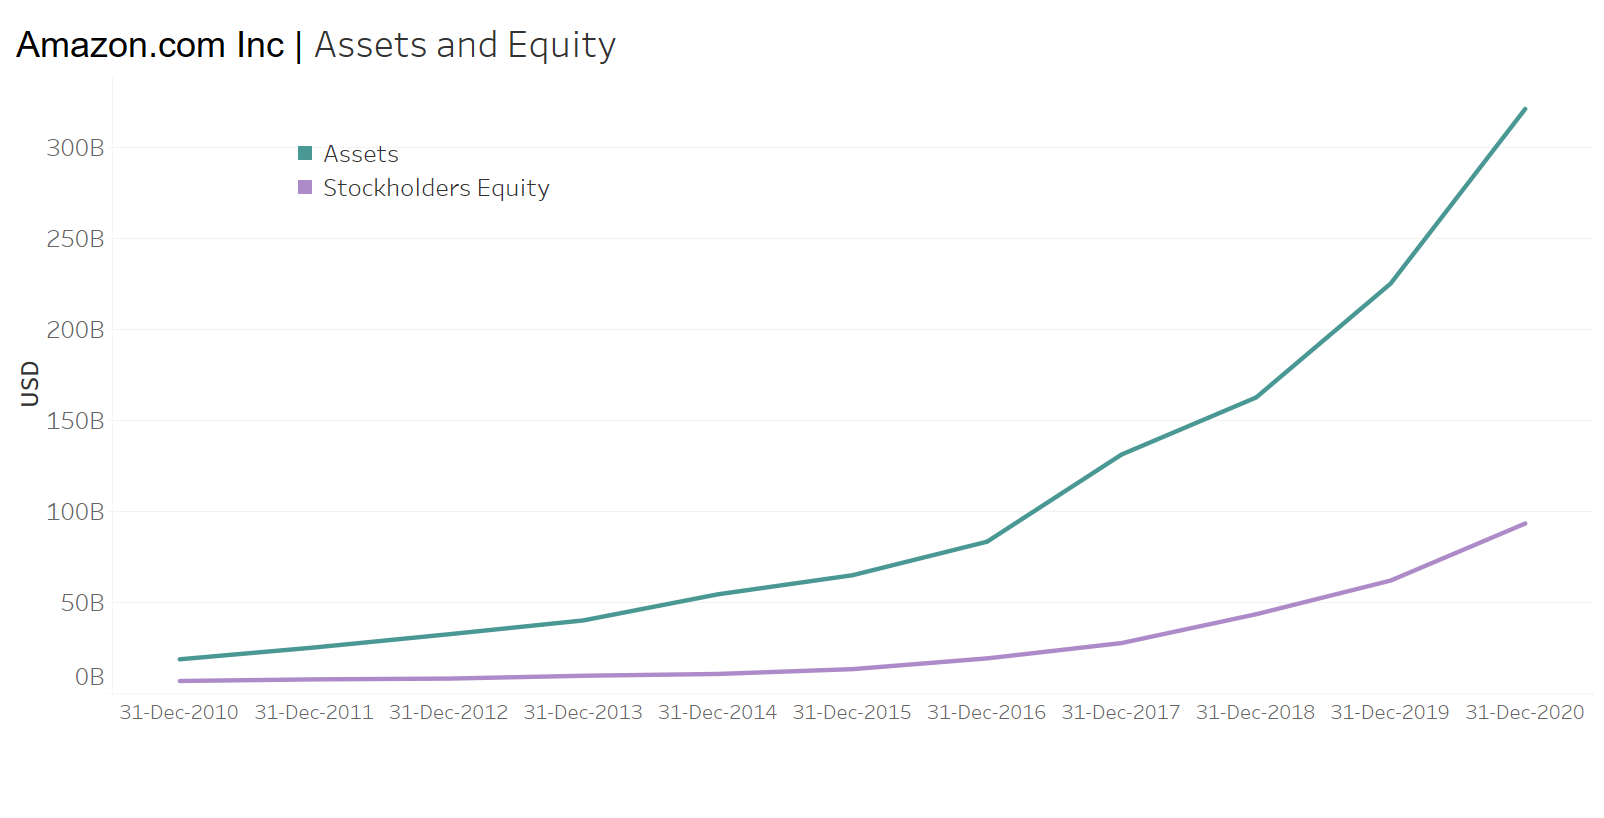
Figure 2: Asset and Equity growth 2010-2020 | Amazon.com
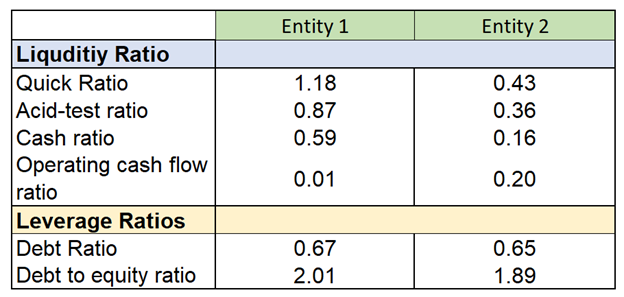
Figure 3: Comparative Ratio analysis from spreadsheet dump of xBRL-JSON reports
The fact that xBRL-JSON can be exported into Excel 365 should excite many business users. They can slice it, filter it, create charts, build pivots, blend it with other data sources and a lot more. The suggestion here is not necessarily to recommend analysing XBRL data in a spreadsheet but to demonstrate it as one of the possibilities.
I am sharing the sample analysis from my experiment. Please feel free to use them to understand how xBRL-JSON data was used to create a range of reports. Create a copy of the sample and start exploring, editing them as you like.
- Tableau | ESEF Sample File
- Tableau |Amazon.com Inc – Analysis from annual filings
- Data Studio Report | ESEF Sample
- Excel 365| Comparing two companies
Please note there is a small amount of pre-processing required as the tools are not natively taxonomy aware. For example, replacing concept QNames with labels, and dealing with duplicates, and in a few cases arranging the facts as an array as opposed to a JSON object, with fact IDs as keys.
I find it remarkable how xBRL-JSON reports can be used ‘as-is’ in analytical tools and believe it significantly improves the consumption friendliness of XBRL reports. The idea here is not to discard the sophisticated analytical infrastructure that many users have implemented but to open the possibilities of doing analysis with a lot more agility.
The best way to appreciate the capabilities of xBRL-JSON is to get your hands dirty and get started with experimentation! For example, regulators can publish XBRL data in xBRL-JSON format to enable data users to explore the new format; software vendors can think about how the third-party analytical tools can be integrated into their offerings – the possibilities are numerous.
I demonstrated this experiment at the recently concluded Data Amplified conference. You can watch the recorded session (for registered attendees) or check back here when we upload the video recording.
Happy exploring!